EPA Leads the Way on Lead Exposure Science and Risk Management
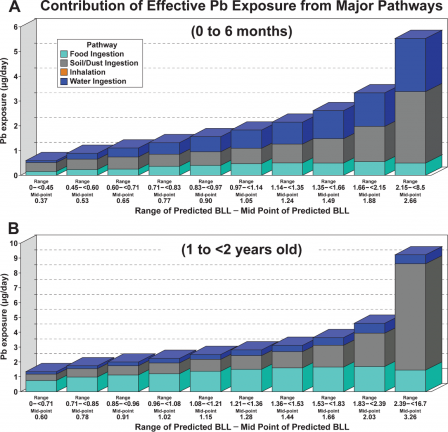 Estimated contribution of exposure pathways to blood lead levels (BLL) at the national scale. The bars are 10% increments in the BLL distribution. Exposure in the figure is adjusted for bioavailability of Pb in each exposure pathway (Zartarian et al 2017).Published October 18, 2017
Three new studies on lead exposure and risk management can inform decisions from national to local scale to better protect children and other vulnerable groups by identifying exposure hotspots and by quantifying how different sources contribute to exposure.
Drinking water isn’t the only source of lead exposure. The soil and dustExit in and around our homes can contain lead. Low levels of lead can also be found in the air we breathe and in some foods. Children, whose brains are still developing, are more susceptible to a host of neurological health effects brought on by lead exposure. The ways that children spend their time can increase their likelihood of exposure—infants and toddlers crawl on the floor and tend to put all sorts of things in their mouths, while older children may spend time playing outside where they too can ingest soil and dust. It’s critical that we know how various sources contribute to lead exposure in children.
EPA researchers have developed a modeling approachExit that improves our understanding of the relationship between lead concentrations of various sources (drinking water, soil and dust, food, and air) and children’s blood-lead levels. Reducing total lead exposure is a long-term goal of EPA, and this model gives us a clearer picture of the lead exposure contribution from multiple sources.
Findings reveal that, on a national scale, drinking water is the most common route of lead exposure among infants (0 to 6 months). But for 1 to 2-year-olds with very high blood-lead levels, soil and dust lead tends to be the main culprit. This isn’t to say that toddlers drinking lead-tainted water isn’t a concern. If exposure to soil and dust and other sources around their homes results in elevated blood-lead levels, then even limited exposure to lead in drinking water can be problematic—which is why this model’s holistic approach is so important.
Paired with additional info like state-collected blood lead level data, the model can help identify communities at greatest risk. The researchers believe that their work can inform decisions to minimize public health risks from national to local scales. This work can foster multi-source lead exposure efforts across government agencies in a coordinated and science-based manner.
The researchers are confident that the model can serve as a valuable tool, but admit that more up-to-date and complete data on various model inputs are needed to refine estimates and reduce uncertainties.
A separate EPA-led studyExit may begin to address one of these data gaps—how does lead found in soils relate to the blood lead levels of children living nearby? Lead comes in different forms, and only some of the lead found in soils can be absorbed by the body and affect our health—this is known as “bioavailable” lead. The study looked at soil samples and blood samples from children living in an area of Philadelphia known to have a legacy of lead contamination. When available, considering the bioavailable portion of soil lead instead of total soil lead can help public health officials improve their lead risk assessments for children.
The work is among the first public health studies based on new bioavailability testing methods for lead developed by EPA to guide site cleanup and revitalization activities. In some cases, focusing on the bioavailable portion of lead can result in significant cost savings (potentially in the tens of millions of dollars) during site remediation, while still ensuring public safety.
Unfortunately, blood lead screening data and lead samples from various sources aren’t always available. Even when the data is lacking, public health departments still need ways to identify particularly vulnerable groups and lead exposure hotspots. A third EPA studyExit developed a statistical model that predicts blood-lead levels among children across the U.S. at the census tract level by using demographic and socioeconomic data such as age of housing stock, poverty rates, and race. The model results can help officials focus their limited resources on communities most vulnerable to lead exposure. Also, if a community does have blood lead level data, and it is significantly higher than what the model predicts, this might serve as a warning to examine soils, drinking water, or other potential sources of exposure.
The lead work presented in these papers follow other EPA lead-related research efforts including dose estimation modeling (IEUBK model) that has been widely used to support Superfund cleanup efforts.
Learn More
2015 NDWAC Recommendations to the Administrator regarding Lead and Copper Rule
Sources and References
Zartarian, V., Xue, J., Tornero-Velez, R., and Brown, J. (2017). Children’s Lead Exposure: A Multimedia Modeling Analysis to Guide Public Health Decision-Making. Environmental Health Perspectives, 097009: 1-10.
Bradham, K.D., et al. (2017). Relationship Between Total and Bioaccessible Lead on Children’s Blood Lead Levels in Urban Residential Philadelphia Soils. Environmental Science & Technology, 51(17): 10005-10011.
Schultz, B.D., Morara, M., Buxton, B.E., and Weintraub, M. (2017). Predicting Blood-Lead Levels Among U.S. Children at the Census Tract Level. Environmental Justice.