EPA Releases Updated SeqAPASS – Version 5.0 – With Improved Functionality
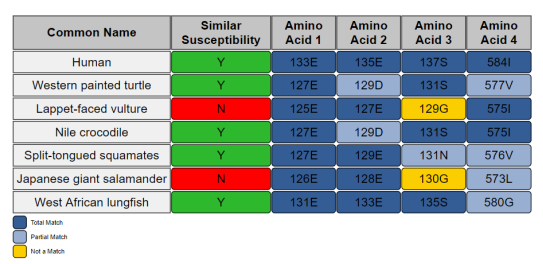 An example of a simple report which shows the amino acid and its respective position. Each amino acid is compared to the template species and can receive a dark blue color (Total match), a light blue color (Partial match), or a yellow color (Not a match). To access more information regarding each amino acid, the user can scroll over the amino acid box to bring up a box with added data.Published December 15, 2020
EPA has released the fifth iteration of the Sequence Alignment to Predict Across Species Susceptibility (SeqAPASS) online tool, now equipped with improved functionalities that help users customize, interpret, and share SeqAPASS results.
The SeqAPASS tool was developed to understand how different chemicals interact with organisms at the molecular level and across species. The online tool provides environmental researchers with predictions about a species’ relative intrinsic susceptibility to chemicals based on the presence or absence of a known chemical protein target.
SeqAPASS mines, collects, and collates information from several sources, including 95 million protein sequences in the National Center for Biotechnology Information (NCBI) protein database. This information can be used to compare molecular sequences and predict likelihood of chemical responses between known sensitive species and non-target species (e.g. we know a lot more about model organisms like rats, mice, and water fleas than we do about most other species). To use SeqAPASS, a user can choose a single or multiple query species and a query protein to understand its conservation across species.
Users can now produce a heat map from SeqAPASS query results, which quickly shows critical amino acid matches between the template species and all other species with an aligning protein. This increases research efficiency by pointing the user in the right direction for further investigation into species susceptibility. Heat maps are also a data visualization tool for publications and presentations, making for improved information sharing.
SeqAPASS provides three levels of species data, making it easier for the user to synthesize data results. Users can download a customizable Decision Summary Report with data tables and visualizations—an easy way to synthesize data is always appreciated in the scientific community!
“With each iteration of SeqAPASS development, we work diligently to carefully consider and incorporate features requested by the SeqAPASS user community,” said EPA’s Dr. Carlie LaLone, one of the SeqAPASS developers. “The desire to rapidly visualize data and integrate each Level of the SeqAPASS evaluation into one report have been the top user requested features and we’ve heard you and delivered with SeqAPASS v5.0.”
Dr. LaLone and her team have continued to make advancements to the SeqAPASS tool since its inception in 2016 in response to user feedback.
Access SeqAPASS version 5.0, the user guide and more information: Sequence Alignment to Predict Across Species Susceptibility (SeqAPASS)