EPA’s EnviroAtlas Publishes Data on Six New Urban Areas, Including Baltimore and Chicago
Published May 21, 2018
All communities rely on clean air, clean water, green space, and other natural amenities for their economic sustainability and quality of life. Often referred to as “ecosystem services,” these functions provide many societal benefits, but aren’t always fully understood or considered in local decision-making. EPA’s EnviroAtlas tool aims to change that by using maps and data to help communities understand the relationship between nature, health, well-being and the economy.
EnviroAtlas is an interactive web-based tool that combines maps, analysis tools, fact sheets, and downloadable data to inform state and local policy and planning decisions. The tool already had fine-scale data and maps for 18 U.S. urban areas, and recently added six more. The new areas include Baltimore, Md., Chicago, Il., New Haven, Conn., Virginia Beach, Va., Birmingham, Ala., and Brownsville, Texas, which cover 430 cities and towns not previously featured in EnviroAtlas.
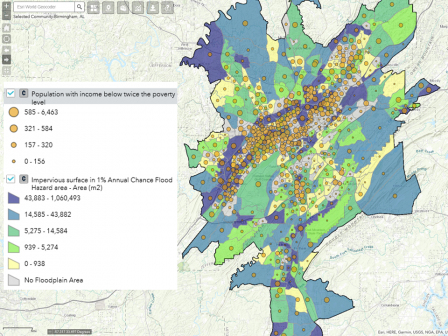 Example of EnviroAtlas map for Birmingham with demographic data overlaid.
The tool shows data at two main scales: national and urbanized community areas. The national component of EnviroAtlas summarizes data for the 48 mainland U.S. states, while the community-component includes additional fine-scale data for 24 exurban to fully urbanized areas, including the six recent additions.
These urban areas include 950 U.S. cities and towns ranging in population from 1,500 to 9.2 million, selected based on environmental and human health data availability, population size, geography and regional interest.
EPA scientist Laura Jackson said the newest areas have a diverse user base who are eager to apply the data to existing community projects.
The availability of existing landcover data was also a strong factor in the selection, particularly for Baltimore, Virginia Beach, and Chicago. “The ten-county Chicago region was the biggest EnviroAtlas community area that we have tackled,” Jackson said. “Since the landcover data are our limiting factor, we decided to take on this huge area!” The EnviroAtlas team is continuing to develop their suite of 100+ data layers for additional communities, with three planned for completion later this year.
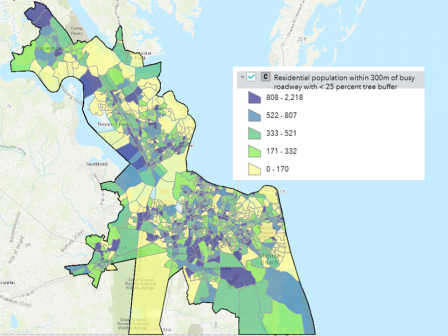 Example of EnviroAtlas map for Virginia Beach with demographic data overlaid.
Community-scale data from EnviroAtlas can be used by community leaders and citizens to inform decisions on urban planning, transportation, children’s health, green infrastructure, parks and more. Jackson admits she’s especially partial to the tool’s high-resolution “heat maps” and spatially explicit data layers that show data down to the home, school, and workplace levels.
“The data shows details like how much tree cover is along the sidewalk area of your local street network, how much green space and pavement are within a ¼ kilometer of any point on the map, and how far any point is from the nearest park entrance,” she noted.
Data with that much detail can help users evaluate very localized conditions, like the potential for heat stress, and opportunities for physical activity, social interaction, and engagement with nature. In addition to EnviroAtlas’ fine-scale data, the tool features fact sheets specific to each community, and an “Eco-Health Relationship Browser” which shows how green infrastructure’s ecosystem services have been linked to more than 30 specific aspects of public health, including cardiovascular disease, obesity, ADHD, and depression. “EnviroAtlas was designed to help communities better use ecosystem services for public good,” Jackson said.
To learn more about EPA’s EnviroAtlas and the many ways you can apply it in your own community, visit www.epa.gov/enviroatlas.