EPA’s EnviroAtlas Publishes Data on Three New Urban Areas, Including Philadelphia and Salt Lake City
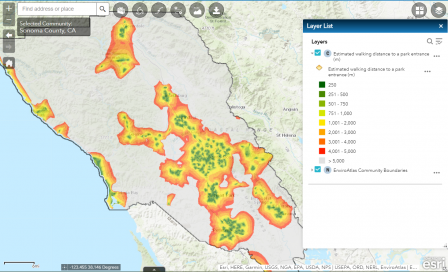 Example of EnviroAtlas map for Sonoma county, highlighting estimated walking distance to a park entrance. Parks come in many forms, from large forested parks to recreational fields, and were included in this analysis if they were within a 5km buffer around the EnviroAtlas community boundary.Published April 8, 2019
Ecosystem goods and services produce the many life-sustaining benefits we receive from nature—clean air and water, fertile soil for crop production, pollination, and flood control. These ecosystem services are important to environmental and human health and well-being, yet they aren’t always fully understood or considered when communities are making decisions. EPA’s EnviroAtlas tool aims to change that by using maps and data to help communities understand the relationship between nature, health, well-being, and the economy.
EnviroAtlas is an interactive and free web-based tool that combines maps, analysis tools, fact sheets, and downloadable data to inform state and local policy and planning decisions. EPA researchers have just added fine-scale data and maps for three new urban areas to EnviroAtlas, in addition to the 24 U.S. urban areas already included in the tool. The new featured areas are Philadelphia, PA, Salt Lake City, UT, and Sonoma County, CA, which collectively include over 300 cities and towns not previously covered. Nearly 7 million people populate the newly included communities alone.
The tool shows data at two main scales: national and urbanized community areas. The national component of EnviroAtlas summarizes data for the 48 mainland U.S. states, while the community-component includes additional fine-scale data for 27 urban areas, including the three recently added communities. The fine scale maps for communities show information accurate down to the census block and 1-meter resolution, making accurate neighborhood-tailored planning a reality.
Community-scale data from EnviroAtlas can be used by community leaders and concerned citizens to inform decisions on urban planning, transportation, children’s health, green infrastructure, parks and more. EnviroAtlas maps can help users evaluate localized conditions and environmental issues, like the potential for disparities in water and air quality across a city, and opportunities for physical activity, social interaction, and engagement with nature. The maps also make it easy to visually gauge environmental health patterns locally and nationally, helping civic leaders evaluate how their community compares to national trends.
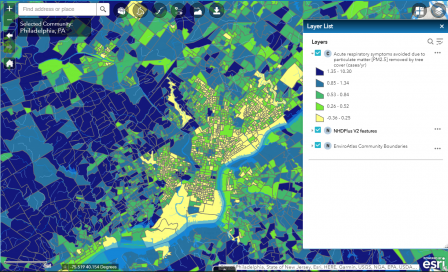 Example of EnviroAtlas map for Philadelphia - community boundaries for fine-scale community data extend far beyond the Philadelphia city limits to effectively cover an urban-to-rural gradient.In addition to EnviroAtlas’ fine-scale data, the tool features fact sheets specific to each community and data layer. These fact sheets describe how community data were collected and provide additional references. EnviroAtlas also features an “Eco-Health Relationship Browser,” using peer-reviewed science to describe how the ecosystem services provided by green infrastructure may provide cost-effective public health benefits. The Eco-Health browser, combined with community maps, can provide powerful and evidence-based leverage to help residents improve their communities.
The EnviroAtlas communities include over 1,300 U.S. cities and towns ranging in population from 1,500 to 9.2 million, selected based on environmental and human health data availability, population size, geography and regional interest.
The EnviroAtlas team is continuing to develop a suite of 100+ data layers with a focus on new metrics and indices for evaluating environmental risks, including emergent contaminants and water quality. All the data layers are freely downloadable.
To learn more about EPA’s EnviroAtlas and the many ways you can apply it in your own community, visit the EnviroAtlas webpage.