Estimating the Health Benefits per-Kilowatt Hour of Energy Efficiency and Renewable Energy
 EPA has developed a set of values that help state and local government policymakers and other stakeholders estimate the outdoor air quality-related public health benefits of investments in energy efficiency and renewable energy (EE/RE). These monetized values were developed using methods consistent with those EPA uses for health benefits analyses at the federal level. To learn more about the health effects included in the benefits per kilowatt hour (BPK) calculations, please see the technical report. For examples of how to use the BPK values, see this flyer.
EPA used a peer-reviewed methodology to develop a set of screening-level regional estimates of the dollar benefits (in cents per kilowatt-hour (kWh)) from four different EE/RE strategies:
 Uniform Energy Efficiency: Energy efficiency programs, projects, and measures that achieve a constant level of savings over time.
 Peak Energy Efficiency: Energy efficiency programs, projects, and measures that achieve savings during 12 PM – 6 PM when energy demand is high (i.e., peak).
 Solar Energy: Programs, projects, and measures that increase the supply of solar energy available (e.g., utility-scale and rooftop solar generation)
 Wind Energy: Programs, projects, and measures that increase the supply of wind available (e.g., wind turbines).
Who might want to use these health benefits per kWh screening values?
Stakeholders interested in approximating the monetized value of the outdoor air quality-related public health benefits of EE/RE, including:
- State and local energy, air quality, or public health agencies
- Public utility commissions
- Energy efficiency and renewable energy project developers
- Industry organizations
- Nongovernment organizations
- Other researchers
When should the health benefits per kWh screening values be used?
The health benefits per kWh (BPK) screening values are reasonable approximations of the monetized health benefits of state EE/RE investments that can be used for preliminary analysis when comparing state and local policy scenarios to indicate direction and relative magnitude of impacts.
Examples of analyses where it would be appropriate to use them include:
- Estimating the public health benefits of regional, state, or local-level investments in EE/RE projects, programs, and policies
- Understanding the cost-effectiveness of regional, state, or local-level EE programs, projects, and measures
- Incorporating health benefits in short-term regional, state, or local policy analyses and decision-making
See examples of how to use the BPK values.
When should health benefits per kWh screening values not be used?
Benefits per kWh values are not a substitute for sophisticated analysis and should not be used to justify or inform federal regulatory decisions. They are based on data inputs, assumptions, and methods that approximate the dynamics of energy, environment, and health interactions and include uncertainties and limitations, as documented in the technical report.
How can health benefits per kWh screening values be used?
States and communities interested in having screening-level estimates of outdoor air quality-related health impacts of energy efficiency or renewable energy can multiply the benefits per kWh values by the number of kilowatt-hours saved from EE or generated from RE to estimate potential health benefits from projects in dollars saved. See examples of how to use the BPK values.
Users should keep in mind there are uncertainties associated with any modeled estimates when interpreting or reporting results.
Understanding the Values
EPA created health benefits per kWh screening values using existing EPA tools, including EPA’s AVoided Emissions and geneRation Tool (AVERT) and CO-Benefits Risk Assessment (COBRA) Health Impacts Screening and Mapping Tool.
The health benefits per kWh values screening values are:
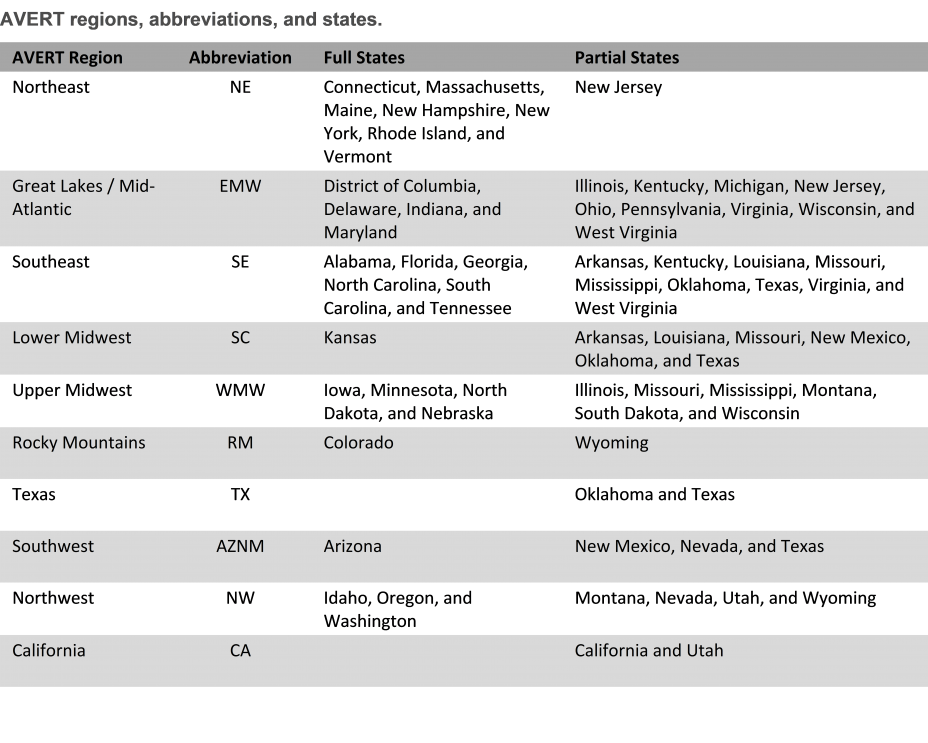
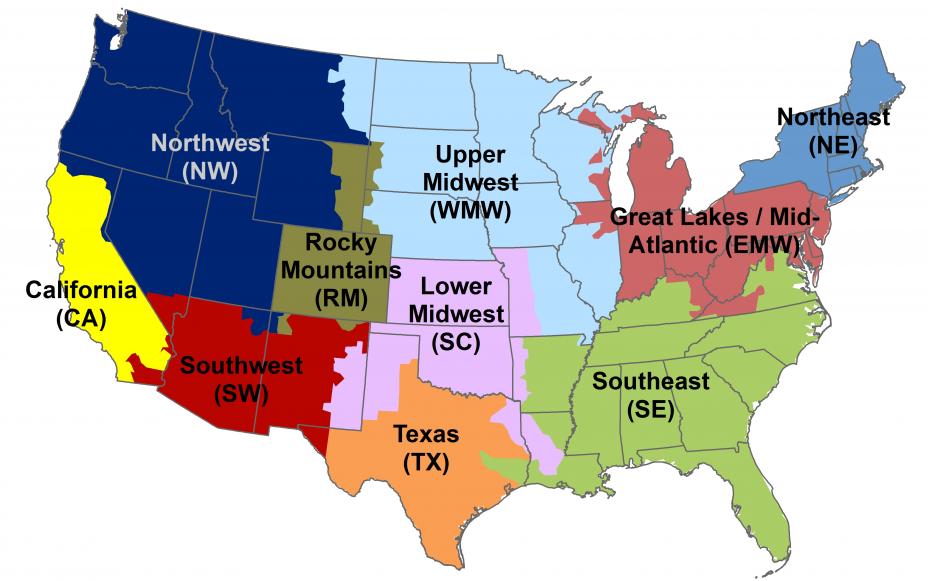
- Available for each of the four project types for each of the ten AVERT regions shown in the map below. Find Your Region
- Based on 2017 electricity generation data and emissions, population, baseline mortality incidence rate, and income growth projections
- Presented in 2017 dollars and reflecting the use of either a 3% or a 7% discount rate as recommended by EPA’s Guidelines for Preparing Economic Analyses (2010)
- Calculated using the same health impact functions EPA uses for regulatory impact analyses, including the calculation of low estimates of mortality using health impact functions that assume people are not very sensitive to changes in PM2.5 levels and high estimates of mortality using functions that assume people are more sensitive to changes in PM2.5
- These estimates include the contiguous United States, but do not include Alaska, Hawaii, Puerto Rico and other U.S. territories. These states and territories are not included in the AVoided Emissions and geneRation Tool (AVERT) used to estimate impacts of EE/RE on air pollution emissions because they do not report emissions data to most of their electric generating units (EGUs) to EPA. These states and territories are also not included in the CO-Benefits Risk Assessment (COBRA) Health Impacts Screening and Mapping Tool used to estimate the health impacts of EE/RE because they were not included in the air quality modeling originally used to develop the tool.
Regional health benefits per kWh values
The health benefits per kWh values are screening-level estimates of the monetized health benefits per kWh – presented in cents per kWh - that represent the benefits from fossil fuel-based generation reduced or avoided as a result of energy efficiency, solar, and wind projects, programs, and policies. For example, the health benefit value of solar programs in California ranges from just under a half a cent (0.45¢) per kWh to 1.15 cent per kWh depending on the discount rate and PM2.5 sensitivity level used.
The benefits per kWh are listed by region and can be multiplied by the number of kilowatt-hours saved from EE or generated from RE in those regions to estimate potential health benefits - in dollars saved - from projects.
EPA suggests users consider both the 3% and 7% discount rates to estimate the range of benefits. The low estimates are most conservative as they assume people are not as sensitive to PM2.5 changes as the high estimates. More information about the underlying methods for quantifing the values is in the technical report.
Health Benefits per kWh values (Cents/kWh in 2017 USD)
| Region | Project Type | 3% Discount Rate | 7% Discount Rate | ||
|---|---|---|---|---|---|
| 2017 ¢/kWh (low estimate) | 2017 ¢/kWh (high estimate) | 2017 ¢/kWh (low estimate) | 2017 ¢/kWh (high estimate) | ||
| California | Uniform EE | 0.48 | 1.08 | 0.42 | 0.96 |
| EE at Peak | 0.52 | 1.17 | 0.46 | 1.04 | |
| Solar | 0.51 | 1.15 | 0.45 | 1.03 | |
| Wind | 0.48 | 1.09 | 0.43 | 0.97 | |
| Great Lakes/Mid-Atlantic | Uniform EE | 3.51 | 7.95 | 3.14 | 7.09 |
| EE at Peak | 3.57 | 8.08 | 3.19 | 7.21 | |
| Solar | 3.67 | 8.29 | 3.27 | 7.39 | |
| Wind | 3.35 | 7.59 | 2.99 | 6.77 | |
| Lower Midwest | Uniform EE | 2.31 | 5.23 | 2.06 | 4.66 |
| EE at Peak | 2.11 | 4.77 | 1.88 | 4.25 | |
| Solar | 2.19 | 4.96 | 1.96 | 4.42 | |
| Wind | 2.35 | 5.32 | 2.10 | 4.74 | |
| Northeast | Uniform EE | 1.65 | 3.73 | 1.47 | 3.33 |
| EE at Peak | 2.24 | 5.07 | 2.00 | 4.52 | |
| Solar | 1.94 | 4.38 | 1.73 | 3.91 | |
| Wind | 1.58 | 3.56 | 1.41 | 3.18 | |
| Pacific Northwest | Uniform EE | 1.13 | 2.55 | 1.01 | 2.28 |
| EE at Peak | 1.12 | 2.54 | 1.00 | 2.27 | |
| Solar | 1.17 | 2.64 | 1.04 | 2.35 | |
| Wind | 1.13 | 2.55 | 1.01 | 2.27 | |
| Rocky Mountains | Uniform EE | 1.03 | 2.32 | 0.92 | 2.07 |
| EE at Peak | 0.98 | 2.21 | 0.87 | 1.98 | |
| Solar | 0.99 | 2.25 | 0.89 | 2.01 | |
| Wind | 1.07 | 2.41 | 0.95 | 2.15 | |
| Southeast | Uniform EE | 1.78 | 4.02 | 1.58 | 3.58 |
| EE at Peak | 1.87 | 4.24 | 1.67 | 3.78 | |
| Solar | 1.83 | 4.15 | 1.64 | 3.70 | |
| Wind | 1.76 | 3.98 | 1.57 | 3.55 | |
| Southwest | Uniform EE | 0.71 | 1.62 | 0.64 | 1.44 |
| EE at Peak | 0.70 | 1.59 | 0.63 | 1.42 | |
| Solar | 0.73 | 1.64 | 0.65 | 1.46 | |
| Wind | 0.77 | 1.73 | 0.68 | 1.54 | |
| Texas | Uniform EE | 1.58 | 3.58 | 1.41 | 3.19 |
| EE at Peak | 1.39 | 3.13 | 1.24 | 2.80 | |
| Solar | 1.42 | 3.22 | 1.27 | 2.87 | |
| Wind | 1.63 | 3.69 | 1.45 | 3.29 | |
| Upper Midwest | Uniform EE | 3.12 | 7.06 | 2.78 | 6.30 |
| EE at Peak | 2.75 | 6.22 | 2.45 | 5.55 | |
| Solar | 2.89 | 6.53 | 2.58 | 5.83 | |
| Wind | 3.20 | 7.23 | 2.85 | 6.45 | |
Other Helpful Tools
In addition to the health benefits per kWh regional values, EPA's AVERT and COBRA tools can be used to develop more specific analyses, such as state- or county-level health benefits estimates.
![]() AVoided Emissions and geneRation Tool (AVERT)
AVoided Emissions and geneRation Tool (AVERT)
Use this tool to estimate the emissions benefits of energy efficiency and renewable energy policies and programs.
![]() CO-Benefits Risk Assessment (COBRA) Screening Model
CO-Benefits Risk Assessment (COBRA) Screening Model
A tool that helps state and local governments estimate and map the air quality, human health, and related economic benefits of clean energy policies and programs.
 Quantifying the Multiple Benefits of Energy Efficiency and Renewable Energy: A Guide for State and Local Governments
Use this guide to learn more about methods and tools you can use to quantify and compare the many benefits of energy efficiency and renewable energy policies and programs, including health benefits.