Lean & Chemicals Toolkit: Chapter 3
Driving Out Chemical Waste with Lean Events
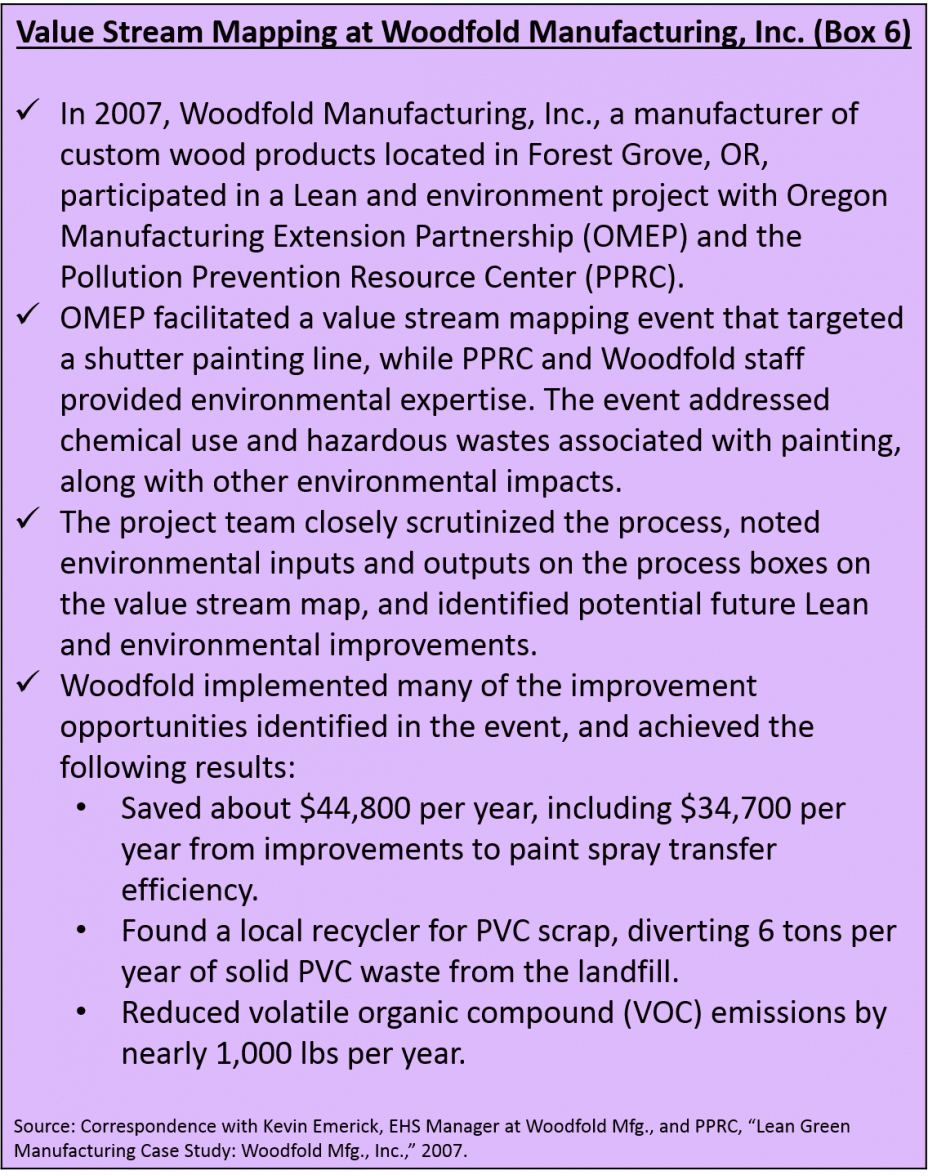
Value Stream Mapping Events
![]() Value stream mapping is a Lean method for creating a visual representation of the flows of information and materials (work in process) between all the activities involved in producing a product for a customer1. The power of value stream mapping lies in walking the plant floor, talking to workers, and closely observing how a product is actually made. Lean practitioners use value stream mapping to:
Value stream mapping is a Lean method for creating a visual representation of the flows of information and materials (work in process) between all the activities involved in producing a product for a customer1. The power of value stream mapping lies in walking the plant floor, talking to workers, and closely observing how a product is actually made. Lean practitioners use value stream mapping to:
- Identify major sources of non-value added time in a value stream (depicted on a “current state” map);
- Envision a less wasteful future state (often shown on a “future state” map and/or an “ideal state” map); and
- Develop an implementation plan for future Lean activities, including kaizen events to improve specific processes in the value stream.
![]() Involving people (internal staff or external experts) with environmental health and safety (EHS) expertise in value stream mapping is one of the most effective ways to enhance your facility’s Lean and environmental performance. Consider inviting EHS staff at your facility to value stream mapping events to identify additional sources of waste in the value stream, quantify environmental wastes and costs associated with processes, and offer outside perspectives on potential process improvement opportunities.
Involving people (internal staff or external experts) with environmental health and safety (EHS) expertise in value stream mapping is one of the most effective ways to enhance your facility’s Lean and environmental performance. Consider inviting EHS staff at your facility to value stream mapping events to identify additional sources of waste in the value stream, quantify environmental wastes and costs associated with processes, and offer outside perspectives on potential process improvement opportunities.
With some minor additions, value stream maps can become powerful tools for learning to see chemical wastes—how chemicals can affect time, quality, and cost. Two strategies for incorporating chemicals into value stream mapping are described below:
- Adding chemical metrics to value stream maps
- Examining key environmental inputs and outputs in value stream maps
See Chapter 3 of EPA’s Lean and Environment Toolkit for additional strategies for reducing environmental wastes using value stream mapping.
Add Chemical Metrics to Value Stream Maps
Although the most common metrics on value stream maps relate to time (e.g., cycle time, changeover time, value added time, and non-value added time), the data boxes in value stream maps can also record other key data for each process, such as environmental wastes and costs.
Add chemical waste information to process data boxes on the current state value stream map to analyze and record how much waste is generated at each process. For example, you could record the amount of hazardous waste generated by a process over a certain time period (e.g., per shift), or you could quantify the costs associated with those wastes. Be sure to include the cost of purchasing the raw materials, time spent managing the wastes, and disposal costs. Figure 4 shows process data boxes with environmental waste included (labeled “FO” for “fallout” wastes in this example). Figure 5 shows an example of a current state value stream map with chemical metrics included.
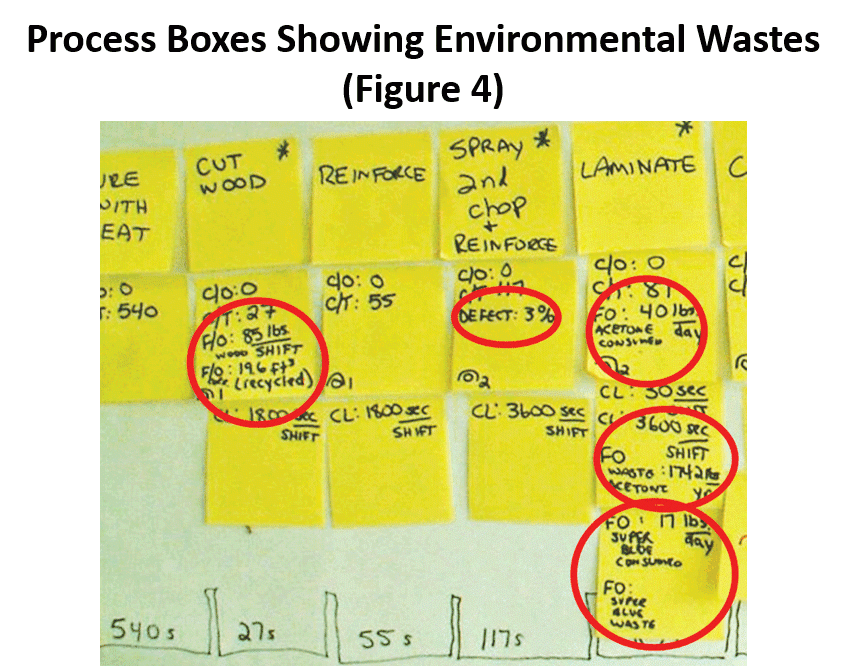
 When chemical metrics are integrated into the current state map along with other Lean metrics, the team conducting the value stream mapping event can use those data to see a more complete picture of the wastes in the value stream and the potential for improvement
 ![]() opportunities. That is, the chemical data can inform the development of a future state map for the value stream and an implementation plan to achieve that future state. Consider identifying at least one kaizen event that targets a large source of chemical waste.
opportunities. That is, the chemical data can inform the development of a future state map for the value stream and an implementation plan to achieve that future state. Consider identifying at least one kaizen event that targets a large source of chemical waste.
Chemical wastes can occur in many parts of the value stream. Too much chemical inventory could lead to expired or off-spec chemicals that require disposal. Excess use of chemicals beyond what adds value from the customer’s perspective and improper use of chemicals (e.g., incorrect mixing) in processes also result in waste. In the chemical manufacturing industry, key sources of waste include chemical reactors, separations, and other process equipment. For example, many chemical reactors require a lot of reactant feed and/or reaction conditions that are crucial to producing the product. Chemical reactors often require precise control of many inputs. If reactant feeds or operating conditions deviate from target values, the process yield may suffer or “off-spec” products may be produced, both of which will likely lead to increased waste.
Examine Key Environmental Inputs and Outputs in Value Stream Maps
Another way to examine environmental wastes in value stream mapping events is to record the key resource “inputs” to each process (e.g., raw materials, energy, and water use) and the key non-product “outputs” that result from each process (e.g., scrap, air emissions, hazardous ![]() waste, etc.) directly onto value stream maps. Use different colored lines to show resource flows and waste flows out of each process data box on the value stream map. In the chemical context, inputs would include chemicals used in the process and non-product outputs would include any hazardous wastes generated (e.g., hazardous chemicals mixed with other materials). Figure 6 provides a conceptual outline of how to add resource input and waste output lines to process maps, while Figures 7 and 8 depict full value stream maps incorporating the input and output lines.
waste, etc.) directly onto value stream maps. Use different colored lines to show resource flows and waste flows out of each process data box on the value stream map. In the chemical context, inputs would include chemicals used in the process and non-product outputs would include any hazardous wastes generated (e.g., hazardous chemicals mixed with other materials). Figure 6 provides a conceptual outline of how to add resource input and waste output lines to process maps, while Figures 7 and 8 depict full value stream maps incorporating the input and output lines.
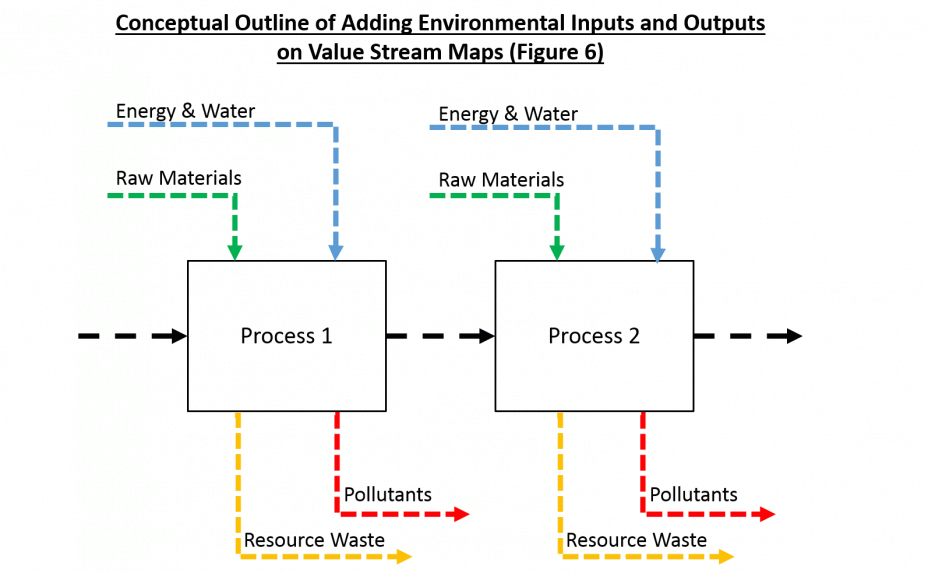
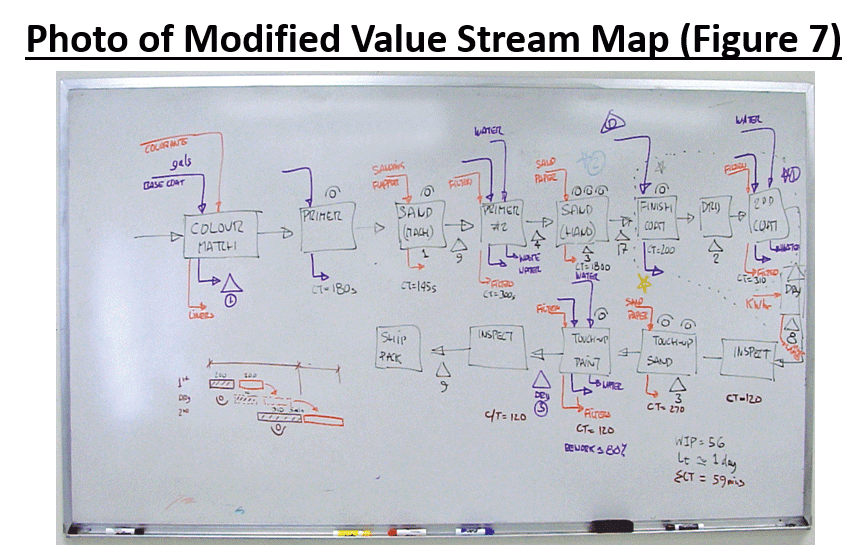
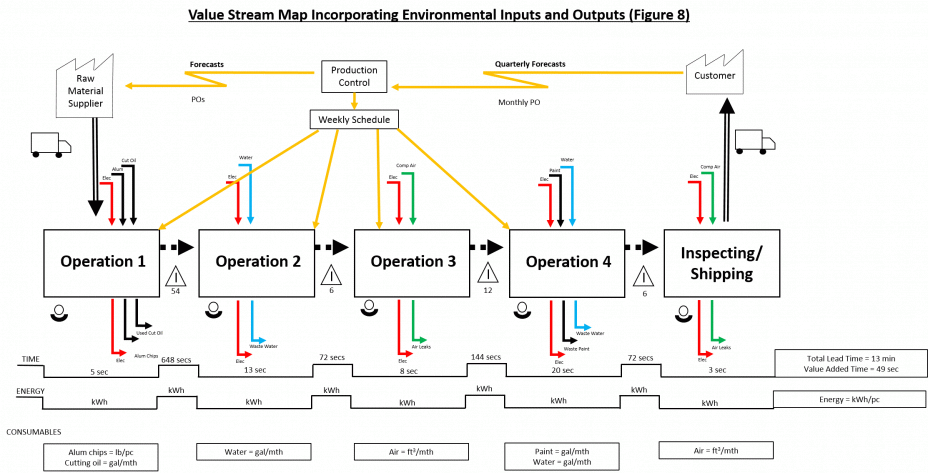 This method combines concepts of traditional Lean value stream mapping with the materials flow process mapping used by pollution prevention (P2) experts. Although the resulting value stream map could look complicated, it can be very powerful to see the Lean and environmental wastes together on a single map. Detailed hierarchical process mapping of environmental inputs and outputs can also supplement value stream maps and/or be developed and used in kaizen events to improve specific processes. See Chapter 4 (Kaizen Events) of EPA’s Lean and Environment Toolkit for more information about hierarchical process mapping.
Kaizen Events
![]() Kaizen is a combination of two Japanese words meaning “take apart” and “make good;” kaizen refers to the philosophy of continual improvement. Kaizen events—also known as rapid process improvement events—are a team activity designed to eliminate waste and make rapid changes in the workplace in a 2–5 day period2. They are a primary means of implementing other Lean methods, such as standard work, 5S (or 6S), one-piece flow, and customer-driven “pull” production.
Kaizen is a combination of two Japanese words meaning “take apart” and “make good;” kaizen refers to the philosophy of continual improvement. Kaizen events—also known as rapid process improvement events—are a team activity designed to eliminate waste and make rapid changes in the workplace in a 2–5 day period2. They are a primary means of implementing other Lean methods, such as standard work, 5S (or 6S), one-piece flow, and customer-driven “pull” production.
Know When to Seek Environmental Health and Safety Expertise in Kaizen Events
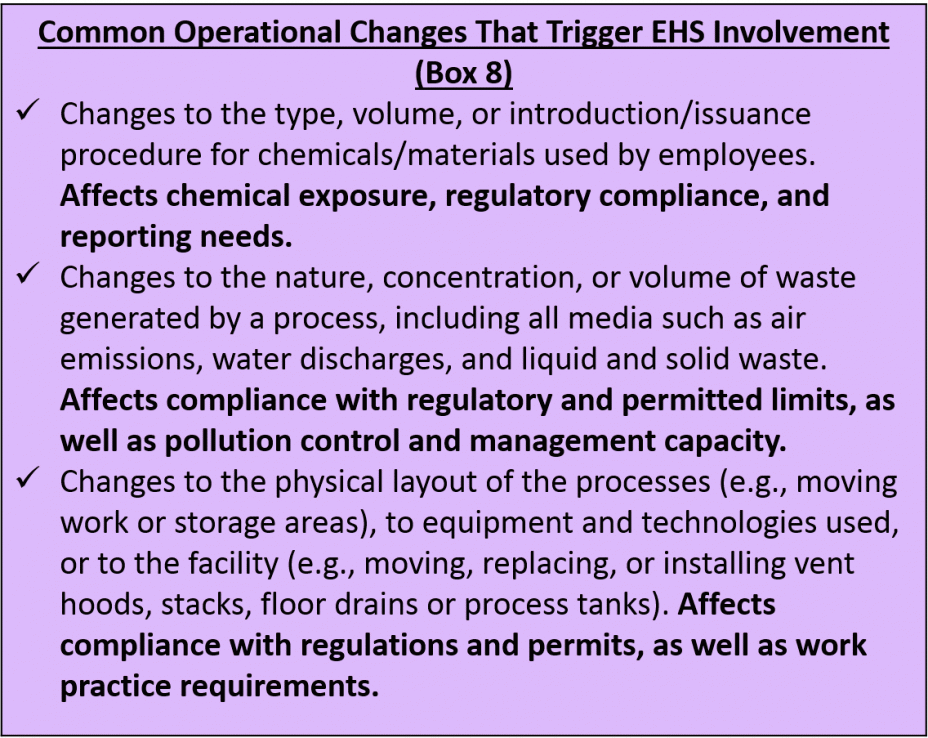
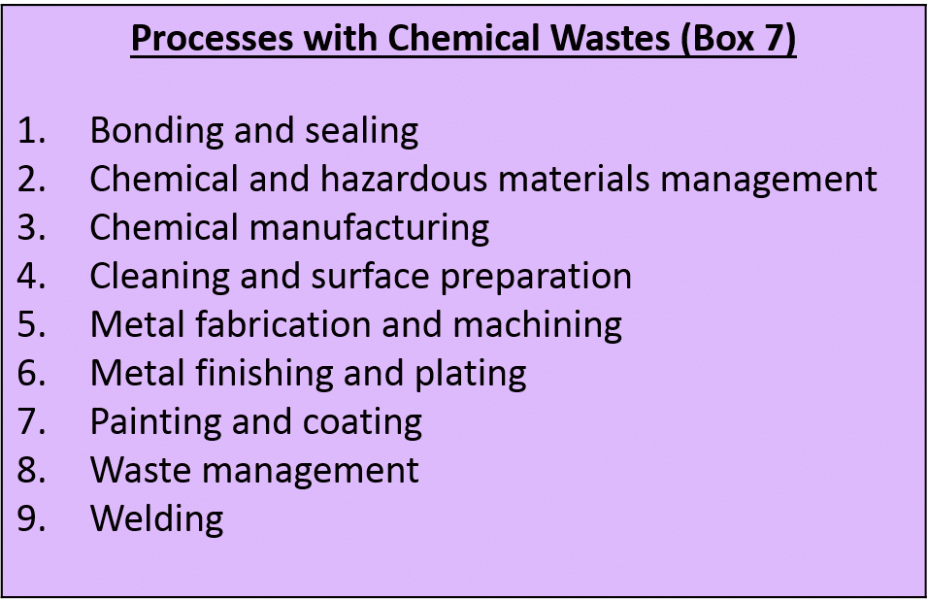
One of the most important ways to reduce chemical wastes and avoid potential regulatory issues is to involve staff with EHS expertise in planning for and conducting kaizen events on environmentally sensitive processes. In particular, if there’s someone at your organization who specializes in chemicals and hazardous waste management, consider inviting that person to participate in value stream mapping events or kaizen events targeting processes that deal with chemicals. Box 7 lists several processes with the potential for significant chemical wastes.
 Many types of Lean events would benefit from EHS staff involvement, especially during the planning phase, to avoid potential regulatory
 ![]() compliance issues and identify additional waste-reduction opportunities. Use the list of Common Operational Changes That Trigger EHS Involvement below as a guide for when to seek additional EHS expertise for Lean events. If EHS staff participated in the value stream mapping event to select Lean implementation priorities, your team should have a good idea of which events would benefit from EHS expertise.
compliance issues and identify additional waste-reduction opportunities. Use the list of Common Operational Changes That Trigger EHS Involvement below as a guide for when to seek additional EHS expertise for Lean events. If EHS staff participated in the value stream mapping event to select Lean implementation priorities, your team should have a good idea of which events would benefit from EHS expertise.
If not properly conducted, these types of operational changes could harm the health and safety of workers, or cause violations of EHS regulations. For example, moving hazardous waste collection areas from central locations to work cells could affect compliance with waste management regulations (e.g., Resource Conservation and Recovery Act regulations). Similarly, replacing existing air pollution control equipment with new right-sized equipment would require permit modifications under the Clean Air Act.
![]() For a more formal system for identifying when to involve EHS experts in Lean events, use the Lean Event EHS Checklist included in EPA’s Lean and Environment Toolkit. Requiring team leaders to complete this form helps ensure that Lean teams involve EHS staff in Lean events when appropriate.
For a more formal system for identifying when to involve EHS experts in Lean events, use the Lean Event EHS Checklist included in EPA’s Lean and Environment Toolkit. Requiring team leaders to complete this form helps ensure that Lean teams involve EHS staff in Lean events when appropriate.
Identify Chemical Wastes in Kaizen Events
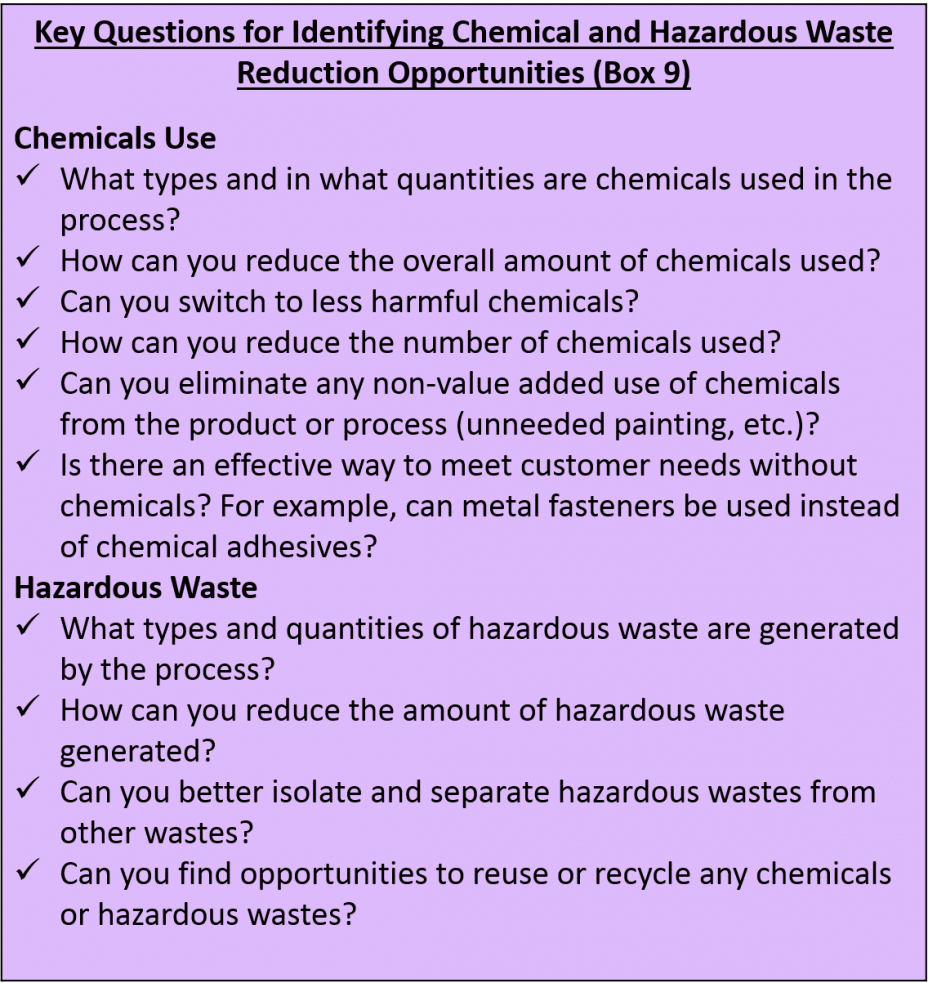
![]() All kaizen event participants can help to identify chemical wastes in processes. Use the Key Questions for Identifying Chemical and Hazardous Waste Reduction Opportunities below as a guide.
All kaizen event participants can help to identify chemical wastes in processes. Use the Key Questions for Identifying Chemical and Hazardous Waste Reduction Opportunities below as a guide.
 Environmental health and safety professionals and technical assistance providers can support kaizen event teams by researching chemicals used in the process, identifying less hazardous chemicals that could be used as alternatives, and finding sector-specific resources and tools for reducing chemical wastes. Appendix A describes several resources that can help reduce chemical wastes and identify safer alternatives to hazardous chemicals; the Appendix also lists non-profit technical assistance providers, as well as general resources about chemicals.
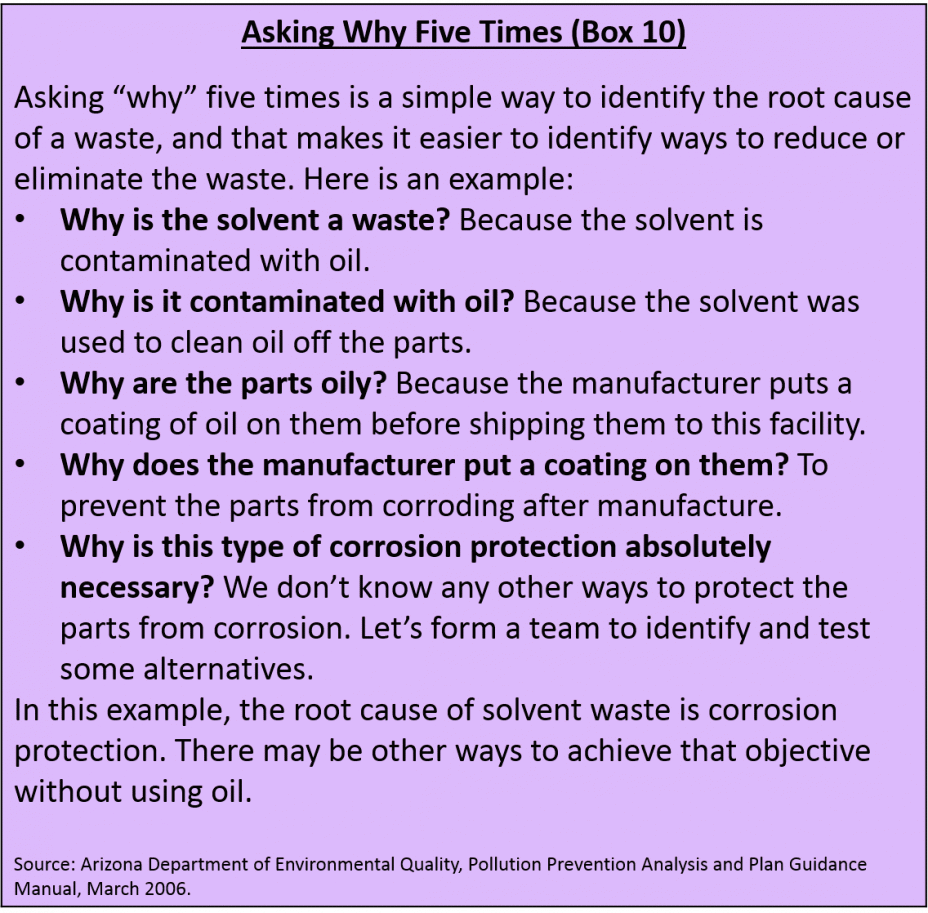
![]() Asking “why” five times is a useful strategy for identifying the root causes of wastes. This approach often reveals simple solutions to eliminate wastes that save time, cut costs, and improve the quality of the process. Box 10 describes an example of how the five whys technique can identify causes of chemical wastes.
Asking “why” five times is a useful strategy for identifying the root causes of wastes. This approach often reveals simple solutions to eliminate wastes that save time, cut costs, and improve the quality of the process. Box 10 describes an example of how the five whys technique can identify causes of chemical wastes.
Conduct Chemical-Focused Kaizen Events
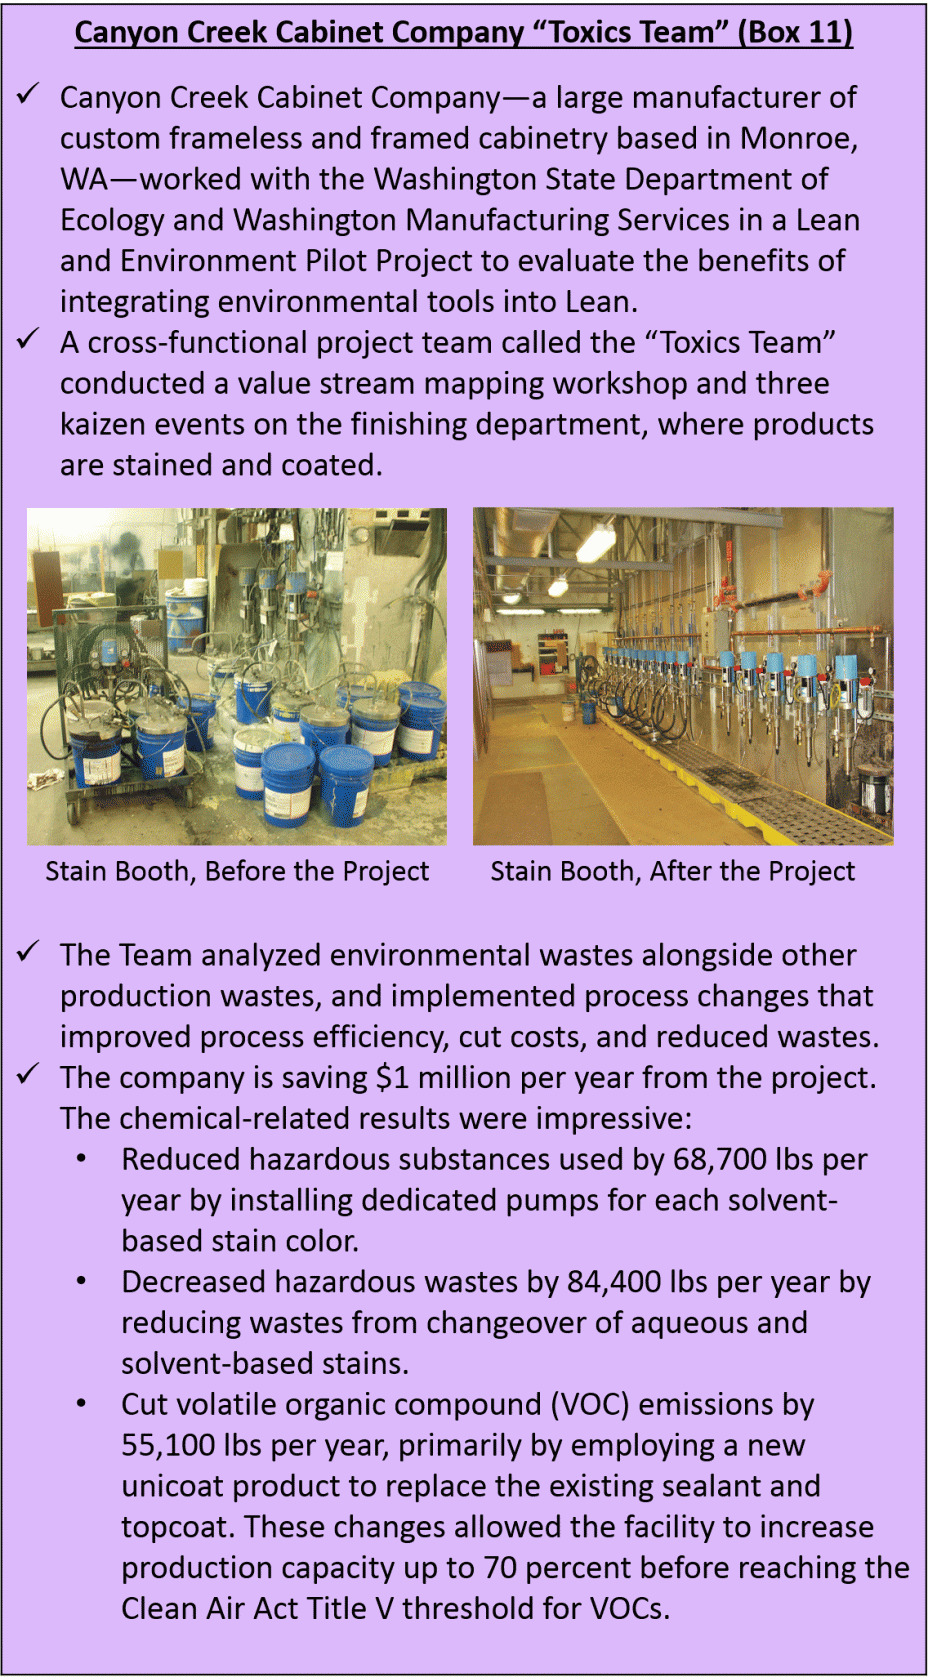
![]() To really drive out chemical wastes at your facility, conduct kaizen events that focus specifically on eliminating chemical wastes. As a starting place, use value stream maps and/or other information to identify processes that generate large quantities of hazardous wastes. Then harness the power of a cross-functional team of employees in a kaizen event to identify and implement process changes to reduce those wastes. In the longer term, consider redesigning processes so that they do not require hazardous chemicals as inputs. Box 11 above describes an example of a Lean and environment project that focused on reducing chemical wastes, along with other Lean wastes.
To really drive out chemical wastes at your facility, conduct kaizen events that focus specifically on eliminating chemical wastes. As a starting place, use value stream maps and/or other information to identify processes that generate large quantities of hazardous wastes. Then harness the power of a cross-functional team of employees in a kaizen event to identify and implement process changes to reduce those wastes. In the longer term, consider redesigning processes so that they do not require hazardous chemicals as inputs. Box 11 above describes an example of a Lean and environment project that focused on reducing chemical wastes, along with other Lean wastes.
Footnotes
1 See Appendix A of EPA’s Lean and Environment Toolkit for more information about value stream mapping.
2 Ibid.
Toolkit Navigation
- Contents & Acknowledgements
- Executive Summary
- Preface
- Chapter 1: Introduction
- Chapter 2: Chemicals Overview
- Chapter 3: Driving Out Chemical Waste with Lean Events
- Chapter 4: Chemical Management in the Lean Organization
- Chapter 5: Managing Chemicals in Lean Workspaces
- Chapter 6: Lean Product and Process Design Methods
- Chapter 7: Conclusion
- Appendix A: Chemical Resources
- Appendix B: Material Safety Data Sheet Template Example
- Appendix C: Point-of-Use Storage Request Form Example

