Lean & Energy Toolkit: Chapter 3
Overview of Energy Use and Lean
- Energy Sources and End Uses
- Understand the Costs of Energy Use
- Energy Efficiency Benefits of Lean
- To Consider
- Footnotes
- Toolkit Navigation
Energy Sources and End Uses
In the manufacturing sector, the predominant energy sources are natural gas and electricity (a secondary source, typically generated off-site by a utility using one or more primary energy sources or fuels). Manufacturers also use other energy sources, such as fuel oil, for producing heat and power on-site. Some facilities have on-site co-generation, where they combust a fuel (e.g., natural gas or wood scraps) to produce heat and electricity. It is also important to note that different fuel sources can have dramatically different greenhouse gas emissions.
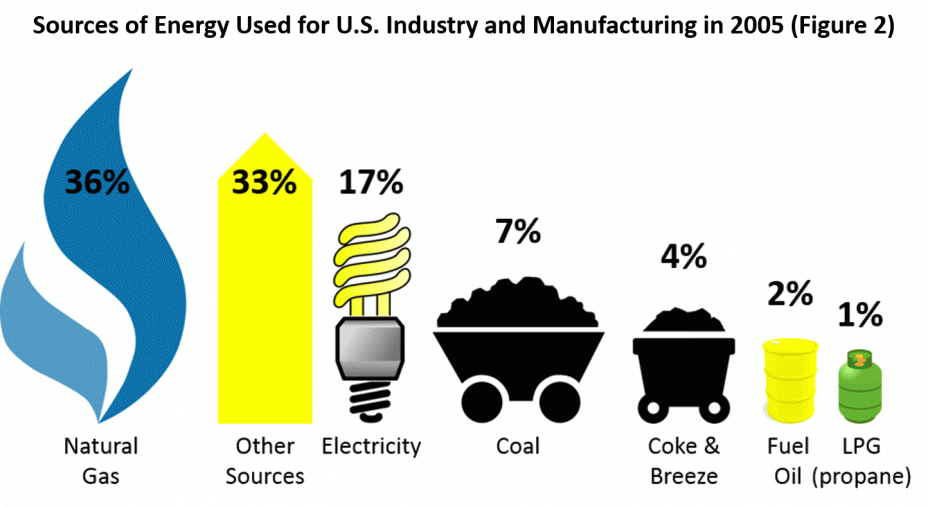
Figure 21 lists major energy sources used by the industry and manufacturing sectors in the U.S. economy.

![]() While identifying energy end uses is often straightforward, determining the amount of energy used by each process can be challenging—but end use information is essential to targeting waste and improvement opportunities. In the context of Lean, it may even be useful to understand energy end use information at the process and equipment levels. Chapter 4 discusses some strategies and techniques for better understanding energy uses and costs at your facility.
While identifying energy end uses is often straightforward, determining the amount of energy used by each process can be challenging—but end use information is essential to targeting waste and improvement opportunities. In the context of Lean, it may even be useful to understand energy end use information at the process and equipment levels. Chapter 4 discusses some strategies and techniques for better understanding energy uses and costs at your facility.
 Looking at energy end uses across the manufacturing sector in the U.S. economy provides an indication of where efficiency improvement opportunities may exist. Tapping into sector-specific resources can help companies identify additional areas of efficiency opportunity within their sector (see Appendix B for information on sector-focused energy reduction resources).
![]() Process heating accounts for 53 percent of direct energy end use at manufacturing facilities, while machine drives and motors account for another 22.1 percent, according to a study by the National Association of Manufacturers2. Consider targeting your facility’s energy efficiency efforts on end uses that are likely to account for a significant portion of your facility’s energy use. Chapters 4- 5 describe specific strategies identifying and reducing the energy used by these and other types of processes.
Process heating accounts for 53 percent of direct energy end use at manufacturing facilities, while machine drives and motors account for another 22.1 percent, according to a study by the National Association of Manufacturers2. Consider targeting your facility’s energy efficiency efforts on end uses that are likely to account for a significant portion of your facility’s energy use. Chapters 4- 5 describe specific strategies identifying and reducing the energy used by these and other types of processes.
Understand The Cost of Energy Use
Understanding the costs of energy use can raise awareness of the potential value of identifying and eliminating energy waste during a Lean event. The costs of energy use are not always “visible” to production managers because they are rolled up into facility overhead costs, rather than assigned to production areas. Explicitly tracking costs associated with individual processes or equipment can encourage energy conservation.
One of the primary sources for energy cost data is your facility’s utility bill. Utility bills often include the following types of data:
- Consumption Charges: Electricity is charged based, in part, on the amount of electricity used (in kilowatt-hours, kWh) in a billing period. The per kilowatt-hour rate for electricity may vary based on the time of year (e.g., winter or summer season) and/or the time of day (peak or off-peak hours).
- Demand Charges: For many electricity customers (all but small accounts), there will be a demand charge (per kilowatt) in the bill that is based on the peak electricity use each month averaged over a short time period (e.g., 15 minutes). Your facility may pay more for demand costs than consumption costs, although the two costs may be a single line item in the utility bill.
- Fuel Costs: For natural gas and other fuels, you may be charged for the amount of fuel you receive (for natural gas this is based on MMBtu, or, thousands of cubic feet- Mcf) and a delivery charge for the transportation and delivery of the fuel. Fuel charges may vary seasonally and based on the amount consumed.
![]() Because of variation in energy use and costs, it can be helpful to use spreadsheets or other systems to monitor your facility’s energy performance and costs over time. An example Electrical Power Bill Analysis Worksheet is provided in Appendix C. ENERGY STAR also offers a free Energy Tracking Tool that helps organizations track all fuels, track progress towards reduction goals and generate reports.
Because of variation in energy use and costs, it can be helpful to use spreadsheets or other systems to monitor your facility’s energy performance and costs over time. An example Electrical Power Bill Analysis Worksheet is provided in Appendix C. ENERGY STAR also offers a free Energy Tracking Tool that helps organizations track all fuels, track progress towards reduction goals and generate reports.
Energy Efficiency Benefits of Lean Implementation
Significant energy savings are typically related to a manufacturing company’s involvement in Lean activities—even without explicit consideration of energy use. The greatest benefits for lean implementation can be understood by thinking about energy in the context of Lean’s “deadly wastes:”
- Overproduction
- Inventory
- Transportation
- Motion
- Defects
- Over processing
- Waiting
Energy Use Reductions as an Indirect Result of Lean Activities
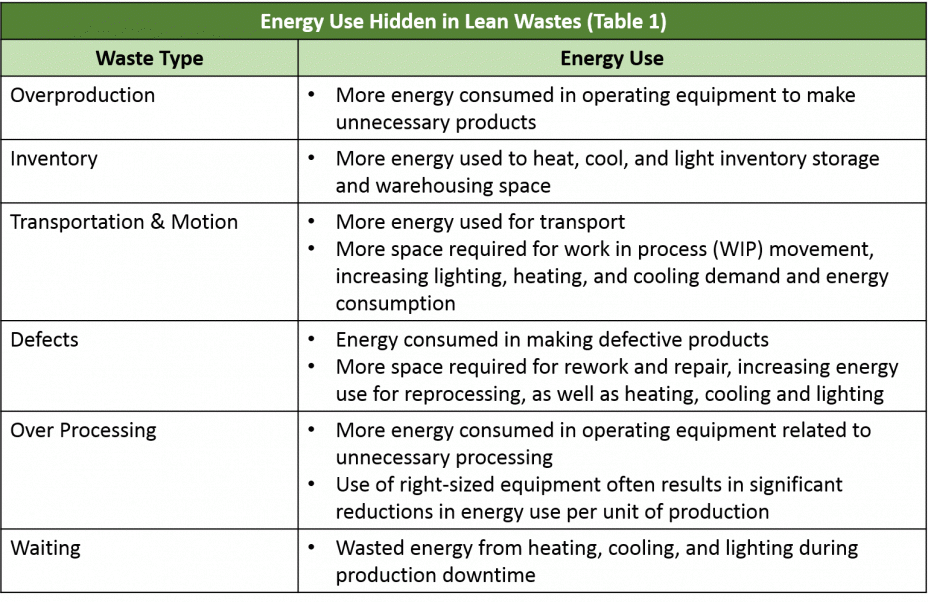
![]() Environmental and energy wastes are not explicitly included in the seven deadly wastes of the Toyota Production System. This does not mean that these wastes are unrelated to Lean. In fact, your company may have already seen large energy use reductions from implementing Lean, because energy and environmental wastes are embedded in, or related to, the seven deadly wastes. Table 1 lists energy impacts associated with wastes targeted by Lean methods.
Environmental and energy wastes are not explicitly included in the seven deadly wastes of the Toyota Production System. This does not mean that these wastes are unrelated to Lean. In fact, your company may have already seen large energy use reductions from implementing Lean, because energy and environmental wastes are embedded in, or related to, the seven deadly wastes. Table 1 lists energy impacts associated with wastes targeted by Lean methods.

![]() Despite these relationships between Lean wastes and energy use, Lean efforts often overlook opportunities to save energy. Your company can enhance its Lean performance by ensuring that energy efficiency opportunities are explicitly identified during Lean activities.
Despite these relationships between Lean wastes and energy use, Lean efforts often overlook opportunities to save energy. Your company can enhance its Lean performance by ensuring that energy efficiency opportunities are explicitly identified during Lean activities.
Footnotes
1 U.S. Energy Information Administration, Annual Energy Review 2005, Washington, DC, July 2006.
2 National Association of Manufactures, Efficiency and Innovation in U.S. Manufacturing Energy Use, Washington DC. 2005.
Toolkit Navigation
- Contents & Acknowledgements
- Executive Summary
- Preface
- Chapter 1: Introduction
- Chapter 2: Integrating Lean, Energy Efficiency and Greenhouse Gas Management
- Chapter 3: Overview of Energy Use and Lean
- Chapter 4: Energy and Greenhouse Gas Assessment Strategies
- Chapter 5: Energy and Greenhouse Gas Emission Reduction Tools and Strategies
- Chapter 6: Conclusion
- Appendix A: Energy and Greenhouse Gas Management Service Providers, Resources and Tools
- Appendix B: Sector-Focused Energy Reduction and Greenhouse Gas Management Resources
- Appendix C: Energy Conversion Resources and Rules of Thumb for Estimating Energy Cost Savings
