Lean & Environment Toolkit: Chapter 3
Value Stream Mapping
- Introduction to Value Stream Mapping
- How to Incorporate Environmental Considerations into Value Stream Mapping
- Overview of Value Stream Mapping Opportunities
- 1. Use Icons to Identify Processes with EHS Opportunities
- 2. Record Environmental Data for Processes in Value Stream Maps
- 3. Analyze Materials Use Versus Need in a “Materials Line” for Value Stream Maps
- 4. Expand the Application of Value Stream Mapping to Natural Resource Flows
- 5. Find Lean and Environment Opportunities in Future State Value Stream Maps
- Conclusion
- Toolkit Navigation
Introduction to Value Stream Mapping
While the last chapter discussed how to raise awareness about environmental wastes across your organization, this chapter will show you how to target Lean improvement efforts within a product’s value stream. The chapter describes ways to enhance value stream mapping to uncover hidden sources of material wastes, identify process improvement ideas, and anticipate regulatory compliance needs.
Definition of Value Stream Mapping
![]() Value stream mapping is a Lean process-mapping method for understanding the sequence of activities and information flows used to produce a product or deliver a service. Lean practitioners use value stream mapping to:
Value stream mapping is a Lean process-mapping method for understanding the sequence of activities and information flows used to produce a product or deliver a service. Lean practitioners use value stream mapping to:
- Identify major sources of non-value added time in a value stream;
- Envision a less wasteful future state; and
- Develop an implementation plan for future Lean activities.
![]() The power of value stream mapping lies in walking the plant floor, talking to workers, and closely observing how a product is actually made from start to finish. See Appendix A for more information on value stream mapping.
The power of value stream mapping lies in walking the plant floor, talking to workers, and closely observing how a product is actually made from start to finish. See Appendix A for more information on value stream mapping.
What This Chapter Will Help You Do
This chapter will help you identify and address the following wastes that can be overlooked in value stream mapping:
- Raw materials used by processes versus materials needed for the product;
- Pollution and other environmental wastes generated in the value stream; and
- Flows of information to regulatory agencies about environmental compliance management activities.
Analyzing these flows in value streams at your company could reveal substantial opportunities to reduce costs, improve production flow, and save time, as well as improve environmental performance and the health and safety of the workplace. Early attention to environmental considerations and involvement of EHS staff when planning for future Lean improvement efforts in a value stream can also help your company address potential regulatory compliance issues, minimize delays, and avoid the need for costly rework.
How to Incorporate Environmental Considerations into Value Stream Mapping
Overview of Value Stream Mapping Opportunities
There are at least five ways to explicitly address pollution and natural resource wastes using value stream mapping:
- Use icons to identify processes with EHS opportunities.
- Record environmental data for processes in value stream maps.
- Analyze materials use versus need in a “materials line” for value stream maps.
- Expand the application of value stream mapping to natural resource flows.
- Find Lean and environment opportunities in future state value stream maps.
1. Use Icons to Identify Processes with EHS Opportunities
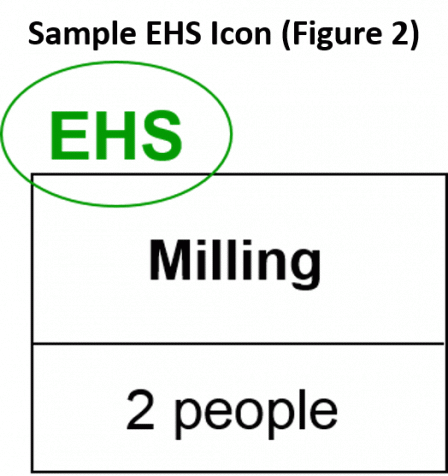
![]() Some processes warrant a special focus on EHS issues because they can pose hazards to workers, have permits and other regulatory requirements, and/or represent good opportunities to reduce pollution and material costs. To raise awareness about these risks and opportunities, use a red dot or an EHS icon (see example below) to identify these processes on value stream maps.
Some processes warrant a special focus on EHS issues because they can pose hazards to workers, have permits and other regulatory requirements, and/or represent good opportunities to reduce pollution and material costs. To raise awareness about these risks and opportunities, use a red dot or an EHS icon (see example below) to identify these processes on value stream maps.
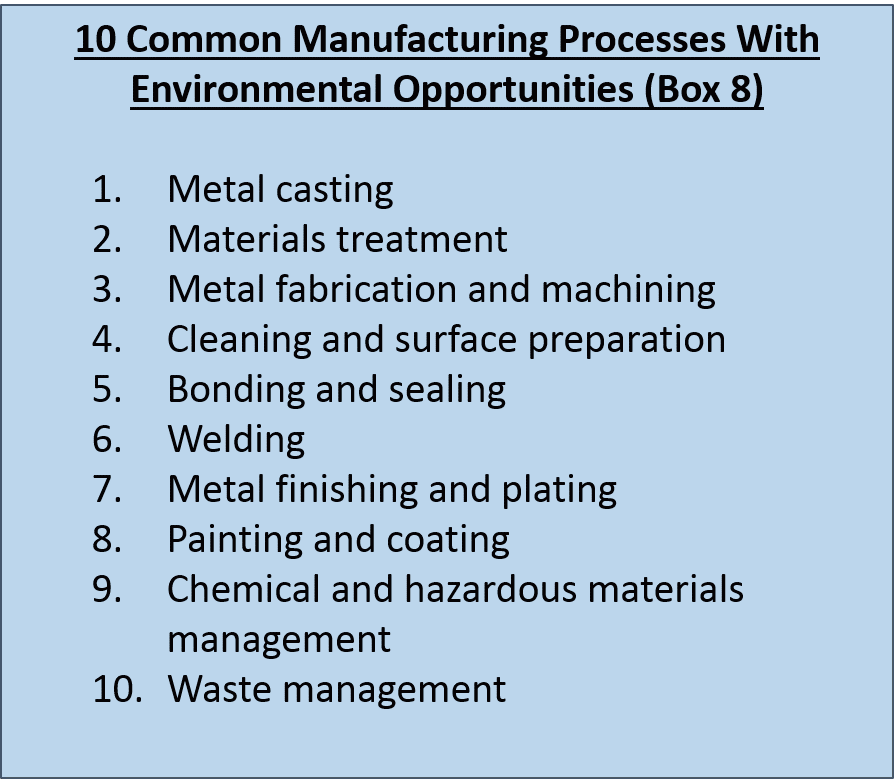
![]() Staff with EHS expertise can help your value stream mapping team determine where to place EHS icons on value stream maps. The textbox below also lists 10 Common Manufacturing Processes with Environmental Opportunities.
Staff with EHS expertise can help your value stream mapping team determine where to place EHS icons on value stream maps. The textbox below also lists 10 Common Manufacturing Processes with Environmental Opportunities.
It is essential for EHS staff to participate in planning for and conducting Lean events on these processes because of ![]() the potential risks of non-compliance and the potential hazards to workers. EHS staff can also bring fresh ideas and new tools to add to the solution set. Chapter 4 provides more information about how to identify and address EHS issues during kaizen events.
the potential risks of non-compliance and the potential hazards to workers. EHS staff can also bring fresh ideas and new tools to add to the solution set. Chapter 4 provides more information about how to identify and address EHS issues during kaizen events.
2. Record Environmental Data for Processes in Value Stream Maps
A second way to uncover environmental wastes in value stream mapping is to select one or two environmental performance metrics to measure for each process in the value stream. A list of types of environmental metrics you could use can be found in Chapter 2; Appendix B provides more detailed information about metrics.
![]() If your company does not already have these data available at the process level, you may need to invest additional time and/or resources to collect environmental data about the current state. For example, you could weigh the amounts of scrap and solid wastes generated by each process during a shift, or use energy meters to estimate typical energy use. This extra investment in data collection, will allow you to appropriately target Lean improvement efforts on the highest priority problems, and thereby achieve the greatest benefits.
If your company does not already have these data available at the process level, you may need to invest additional time and/or resources to collect environmental data about the current state. For example, you could weigh the amounts of scrap and solid wastes generated by each process during a shift, or use energy meters to estimate typical energy use. This extra investment in data collection, will allow you to appropriately target Lean improvement efforts on the highest priority problems, and thereby achieve the greatest benefits.
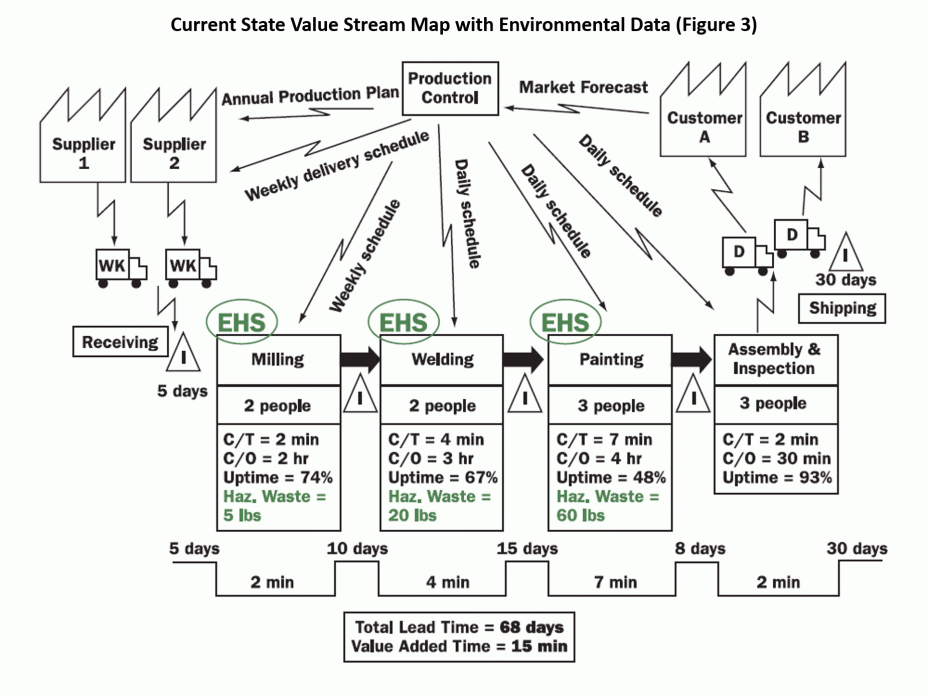
The figure below shows a current state value stream map that includes both EHS icons and environmental data for each process. In this case, each process box lists the amount of hazardous waste generated by that process per shift in addition to commonly collected data on cycle time (C/T), changeover time (C/O), and machine uptime.
3. Analyze Materials Use Versus Need in a “Materials Line” for Value Stream Maps
![]() Value stream maps typically examine the time it takes to produce a product and the proportion of that time that is value added, but they do not focus on the resources consumed and wasted in the development of that product. Raw materials are often a large source of a product’s costs, so looking explicitly at the material flows in a value stream is another way to leverage greater gains.
Value stream maps typically examine the time it takes to produce a product and the proportion of that time that is value added, but they do not focus on the resources consumed and wasted in the development of that product. Raw materials are often a large source of a product’s costs, so looking explicitly at the material flows in a value stream is another way to leverage greater gains.
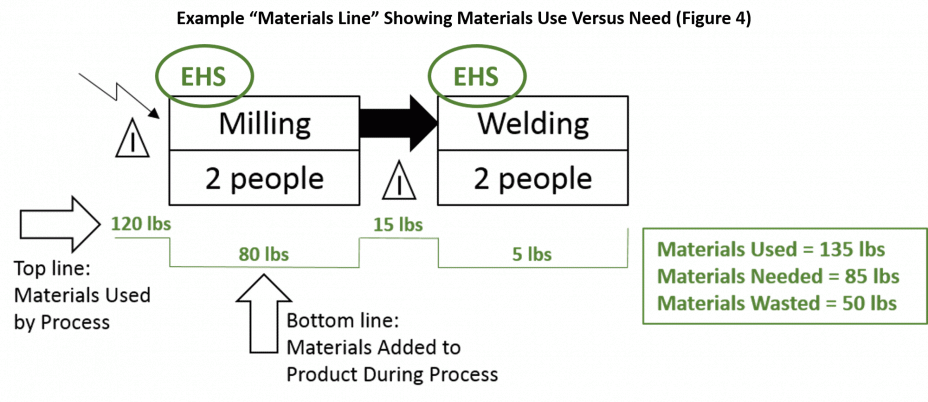
One way to do this is to draw a “materials line” on the bottom of a value stream map that shows two types of data:
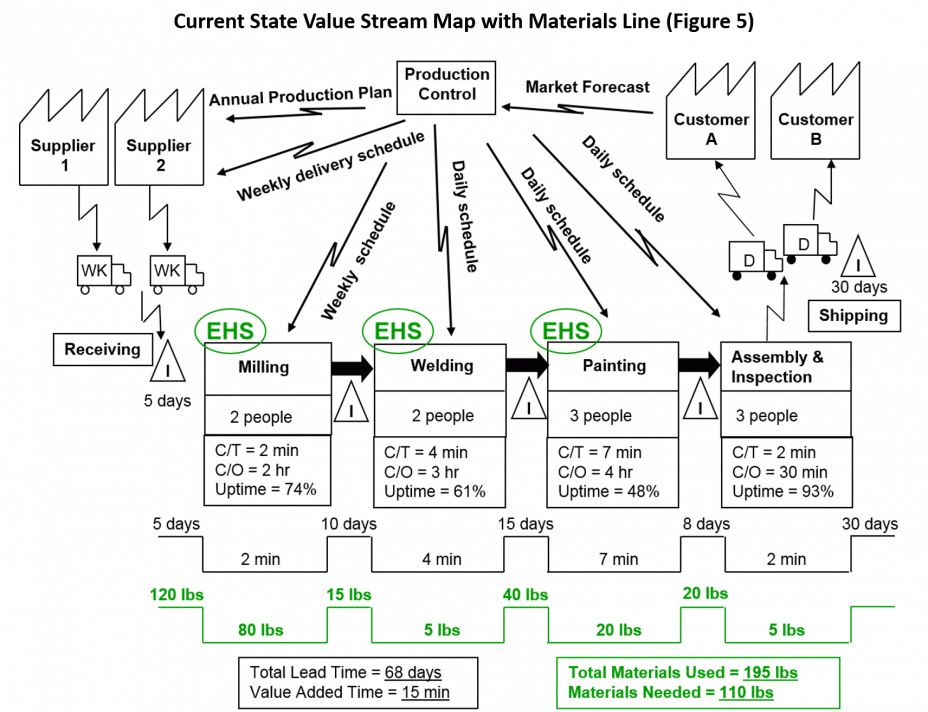
![]() The materials line is analogous to the “timeline” on value stream maps, and can be developed for any type of resource (e.g., water, energy, total materials, and/or a critical substance used in the product). The figure below shows an example of a materials line. In this example, the milling and welding processes consumed 135 pounds of materials, but only 85 pounds were actually needed and added to the product. Fifty pounds of materials were wasted.
The materials line is analogous to the “timeline” on value stream maps, and can be developed for any type of resource (e.g., water, energy, total materials, and/or a critical substance used in the product). The figure below shows an example of a materials line. In this example, the milling and welding processes consumed 135 pounds of materials, but only 85 pounds were actually needed and added to the product. Fifty pounds of materials were wasted.
Once you collect data for the materials line, you may notice large differences between the amount of material used and the amount needed for the product. This can help you target Lean improvement efforts on the largest sources of waste. Below you can see a complete example of a value stream map with a materials line.
4. Expand the Application of Value Stream Mapping to Natural Resource Flows
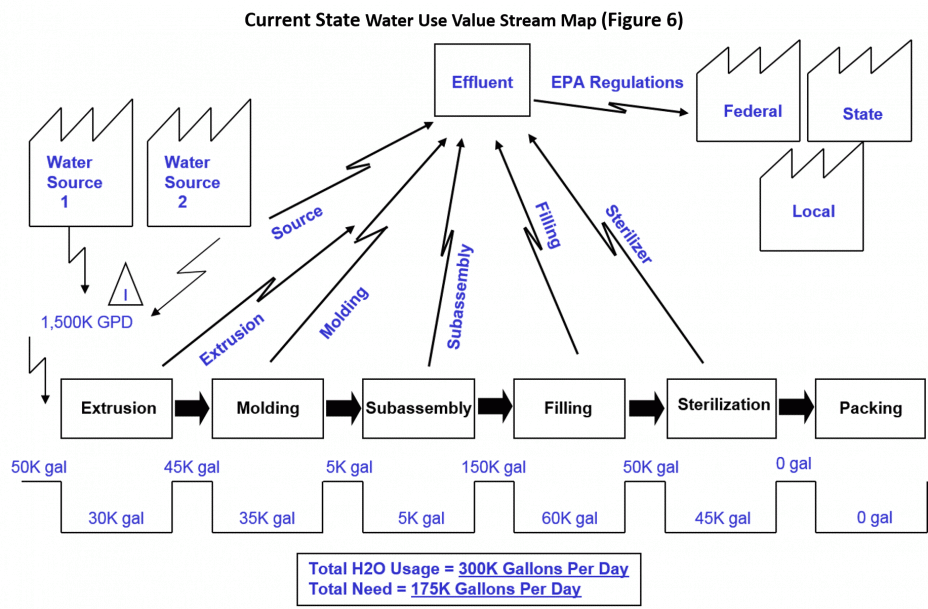
In contrast to adding a materials line to a conventional value stream map (as discussed above), you can also use value stream maps to look in more detail at the inputs, outputs, and information flows associated with the use of energy, water, and/or materials. Along with comparing materials use versus need for each process in the value stream, you can examine environmental waste streams (i.e., non-product outputs such as air emissions, wastewater, hazardous wastes, and trash) and the flows of information to environmental regulatory agencies.
Below is a water-use value stream map for a product that contains water (e.g., a medical IV bag). This value stream map includes a materials line summarizing the amount of water that is used and needed by each process in the value stream. There are arrows showing the flow of wastewater from each process to the sewer and another arrow depicting the flow of information about wastewater discharges to regulatory agencies.
This type of detailed examination of material flows can help you find hidden sources of waste in the value stream. All three elements of a materials-flow value stream map—the materials line, environmental waste flows, and regulatory information flows—can also be targets for future Lean efforts.
5. Find Lean and Environment Opportunities in Future State Value Stream Maps
All the tools and techniques described thus far in this chapter—EHS icons, environmental metrics, addition of a materials line, and materials-flow tracking—can help you to see environmental wastes in the current state of the value stream as well as identify targets for future Lean implementation activities.
![]() Consider the following Questions about the Future State of a Value Stream when developing the future state value stream map. These questions, along with input from any EHS staff participating in your team, can help to:
Consider the following Questions about the Future State of a Value Stream when developing the future state value stream map. These questions, along with input from any EHS staff participating in your team, can help to:
- Envision ways to eliminate environmental wastes in the value stream; and
- Recognize when Lean improvement events could raise EHS compliance issues and, therefore, require involvement of staff with EHS expertise.
Questions About the Future State of a Value Stream Map
- Where are kaizen events (discussed in Chapter 4) needed to address the biggest areas of environmental wastes? These might include:
- Processes with high energy, water and/or materials use; and
- Processes that generate large amounts of solid waste, hazardous waste, and/or pollution.
- Will any changes be made to the layout of processes marked with an EHS icon or to the chemicals used by those processes? (These changes could have potential implications for regulatory compliance practices.)
- Can one process use the "waste" material from another process instead of using virgin materials?
- What would an ideal state for the value stream look like with zero wastes, where products and processes posed no risks to health or the environment, and where there was no need for permits?
- What steps can be taken now to get to that ideal state?
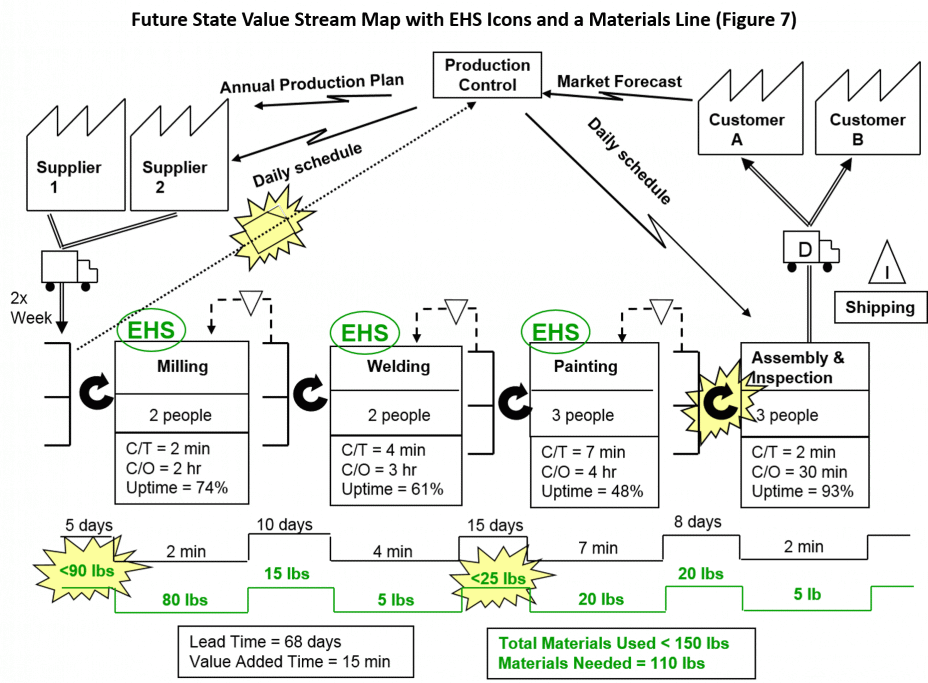
Below is a future state value stream map that includes kaizen starbursts for environmental improvement opportunities as well as changes to establish a “pull” system to control inventory levels and improve production flow.
When developing the kaizen implementation plan associated with the future state value stream map, remember that Lean events on certain processes (including processes with environmental regulatory requirements and others labeled with EHS icons) may require special attention to EHS issues.
![]() It is critical to involve staff with EHS expertise early in planning for Lean events on processes with EHS opportunities. EHS staff can:
It is critical to involve staff with EHS expertise early in planning for Lean events on processes with EHS opportunities. EHS staff can:
- Anticipate changes needed to environmental compliance practices from Lean activities and help implement those changes as quickly as possible;
- Bring a different perspective to Lean activities and additional ideas for waste-reduction opportunities; and
- Ensure that Lean activities improve or cause no harm to worker health, safety, or the environment.
In the next chapter you will learn more about how to integrate environmental considerations into the implementation of kaizen events at your company.
Conclusion
Summary
Value stream mapping is a Lean process-mapping method for understanding the sequence of activities and information flows used to produce a product or deliver a service. Conventional value stream mapping can overlook three types of environmental considerations:
- Raw materials used in products and processes;
- Pollution and other environmental wastes in the value stream; and
- Flows of information to environmental regulatory agencies.
There are at least five ways to explicitly address pollution and natural resource wastes using value stream mapping:
- Use icons to identify processes with EHS opportunities in value stream maps, and involve EHS staff in planning Lean events on those processes.
- Record environmental performance data for processes in value stream maps, and consider these data in developing a vision for the future state.
- Analyze materials used by each process versus materials actually needed for the product, and summarize this information in a “materials line” below the timeline on value stream maps.
- Expand the application of value stream mapping to natural resource flows such as energy and water use, by including additional information on materials use, waste streams, and regulatory information flows in the maps.
- Consider Lean and environment questions, as well as environmental data included in the current state map, when developing the future state map.
Environmental, health, and safety professionals can help to:
- Collect environmental performance data for processes in the value stream;
- Identify processes with environmental opportunities in value stream maps; and
- Make sure that changes to those processes are managed safely and effectively through Lean implementation.
Toolkit Navigation
- Contents & Acknowledgements
- Preface
- Chapter 1: Introduction: Getting Started with Lean & Environment
- Chapter 2: Identifying Environmental Waste
- Chapter 3: Value Stream Mapping
- Chapter 4: Kaizen Events
- Chapter 5: 6S (5S + Safety)
- Chapter 6: Conclusion and Implementation Strategies
- Appendix A: Lean Methods
- Appendix B: Basic Environmental Measures for Lean Enterprises
- Appendix C: Lean Event EHS Checklist
- Appendix D: Pollution Prevention Resources
- Appendix E: 6S Safety Audit Checklist

