Lean & Water Toolkit: Appendix C
Water Unit Conversions and Calculations
- Water Unit Conversions
- Calculations and “Rules of Thumb” for Estimating Water Use
- Guidelines for Estimating Cost and Water Savings
- General Calculations and On-Line Calculators
- Toolkit Navigation
This appendix provides reference material on water unit conversions as well as guidance for estimating water use and potential water and cost savings.
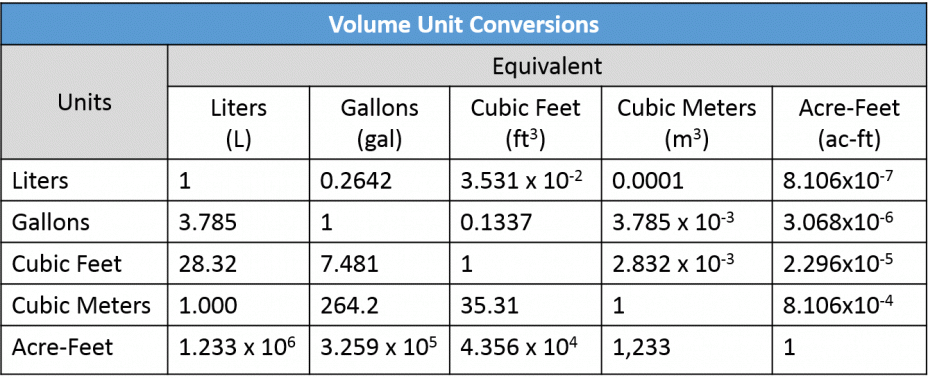
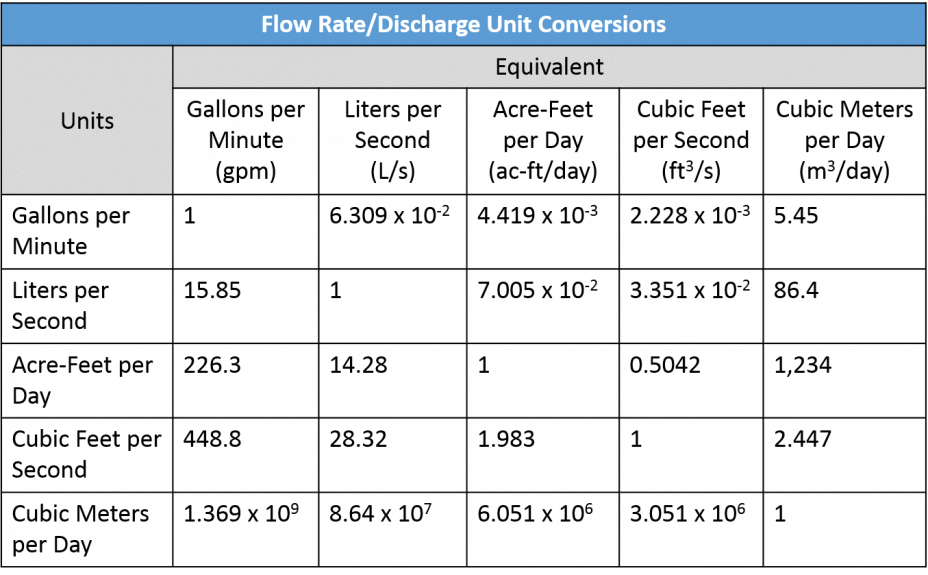
Water Unit Conversions


Calculations and “Rules of Thumb” for Estimating Water Use
Use these guidelines and calculations to estimate water use in your facility. The information in this section draws primarily from GEMI’s Collecting the Drops: A Water Sustainability Planner™ (See Appendix B).
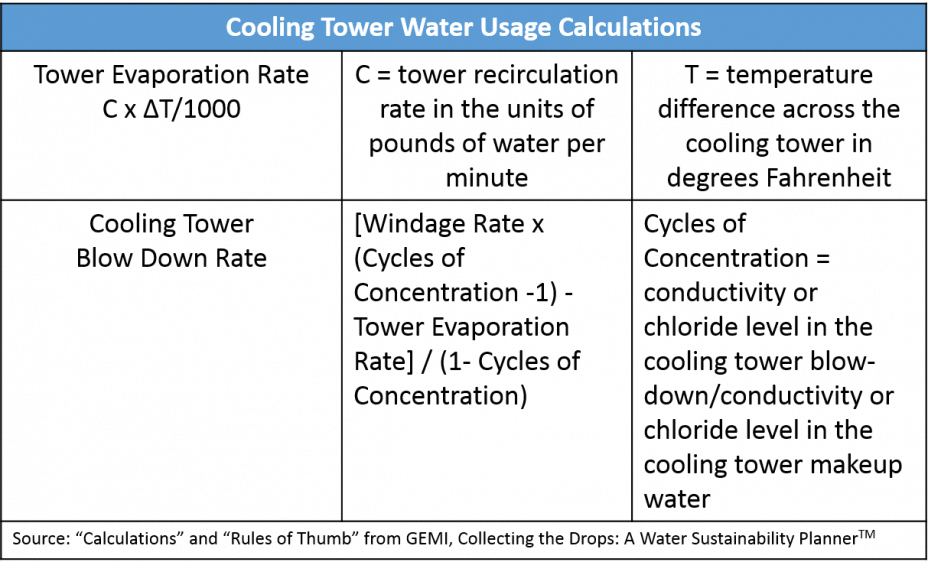
Cooling Tower Usage
 Windage Loss from Cooling Towers (Water Lost from Friction Between Wind and the Surface of the Water in Cooling Towers):
- Commonly 0.1 to 0.3% of the Recirculation Rate
- The tower recirculation rate can be obtained from the manufacturer’s literature and/or head versus flow curve for the pump
Boiler Usage
 Sanitary Water Usage
- 10–25 gallons per person per shift in industrial settings
- The lower value is used where there are just toilets. A higher value is used where there are toilets, showers, and full kitchen services (that is, food preparation and dish washing)
- 20-35 gallons per employee per day for domestic demands (not including kitchens) in commercial/industrial settings
- Savings of 25-35 percent in this domestic usage are readily achievable
Irrigation Usage
- Number of sprinkler heads x the flow capacity per head (e.g., 2.5 gpm x the duration [minutes] of water application)
- Inspect the irrigation system during operation to determine if there are leaks from broken sprinkler heads and from water distribution lines
Wastewater Streams from Water Treatment Operations
- Reverse Osmosis Reject Flow
- Reject stream generally ranges from 10 to 50% of the feed to the system depending on the salinity and the desired purity
- Reject flow can be higher than the indicated range. Reverse osmosis reject streams can be used as cooling tower makeup if the water is softened prior to the reverse osmosis system
Other Uses
- Slab Washing
- 5 gal/min for each hose
- 1 drip/second
- 10,000 L/year or 2,642 gal/year
- Water Flow Estimation
- Use a bucket and stop watch
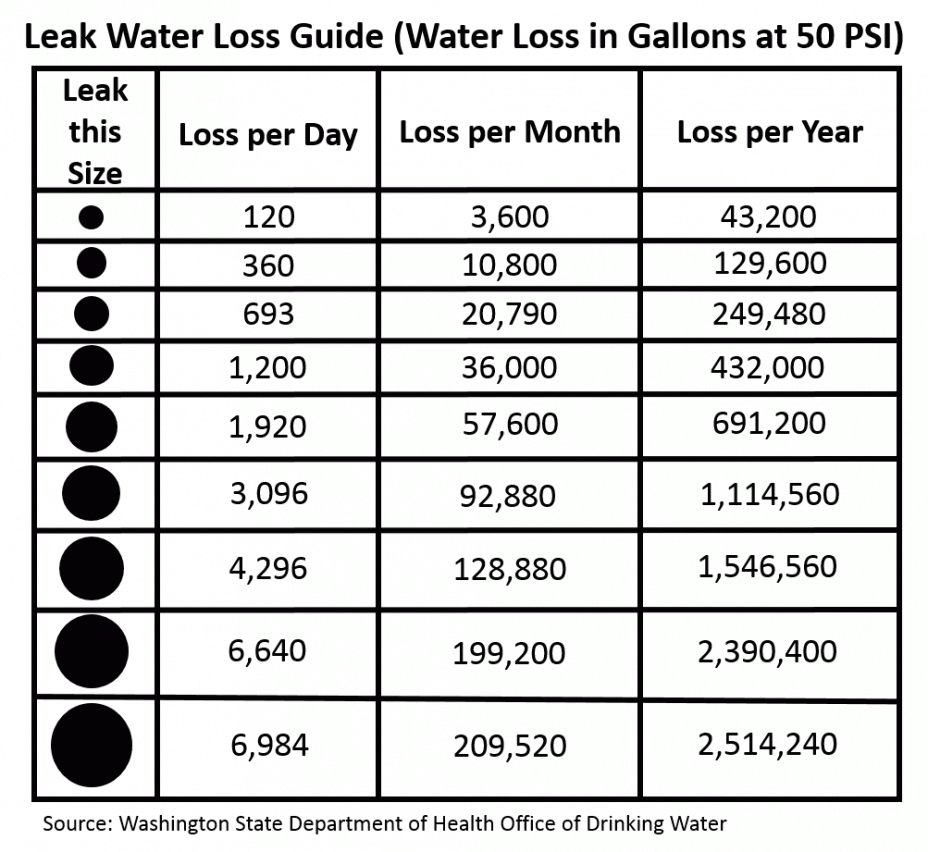
Water Losses from Leaks
- Estimate leaks based on the size of the hole and the water pressure (see Leak Water Loss Guide below), or measure directly using a bucket and stop watch

Guidelines for Estimating Cost and Water Savings
It can be useful to estimate the potential long-term water and cost savings that will result from implementing water efficiency improvements in your facility. This section provides guidelines on producing estimates of these savings after implementing improvements to a process at our facility.
Current Water Use
First, to estimate the current water use of an entire process at your facility, identify the following information and use Equation 1 below.
- Average volume of water used during a full process or technology cycle.
- This may be provided by the product manufacturer through product literature or the manufacturer’s website, or by using the guidelines and calculations in the previous section of this Appendix. The water efficiency will be dependent upon the flow rate of each process cycle, duration of each cycle, and the number of cycles. If the water use from the full process is not available from the manufacturer, sum the water use from each part of cycle to determine the water use from the full process cycle.
- Average number of cycles per day
- Days of facility operation per year
 Water Use after Replacement or Retrofit
To estimate the water use of a more efficient technology or process change, use Equation 1, but substitute the average volume of water used during an improved process cycle.
Water Savings
To calculate water savings that can be achieved from a technology or process change, identify the following information and use Equation 2 below.
- Current water use as calculated using Equation 1
- Water use after replacement or retrofit as calculated using Equation 1
 Payback
To calculate the simple payback from a technology or process change, identify the following information and use Equation 3 below.
- Equipment and installation cost of the replacement or retrofit
- Water savings as calculated using Equation 2
- Facility-specific cost of water and wastewater
 Return on Investment
To calculate the return on investment of a technology or process change, calculate the amount of cost savings as compared to the initial investment using Equation 4.

General Calculations and On-Line Calculators
GEMI’s Collecting the Drops: A Water Sustainability Planner™ has several on-line and downloadable calculators for measuring data related to water use and flows (See Appendix B). These include:
• Flow rate calculator
• Friction loss and flow calculator
• Pump hydraulic horsepower calculator
• Water balance template and calculator
Toolkit Navigation
- Contents & Acknowledgements
- Executive Summary
- Preface
- Chapter 1: Introduction
- Chapter 2: Water Use and Water Waste at Industrial Facilities
- Chapter 3: Finding Water Waste on the Factory Floor
- Chapter 4: Lean and Water Efficiency Improvement Strategies
- Chapter 5: Lean and Water Beyond the Factory Floor
- Chapter 6: Conclusion
- Appendix A: Water Efficiency Resources and Technical Assistance Providers
- Appendix B: Water Cost Calculator
- Appendix C: Water Unit Conversions and Calculations
- Appendix D: Water Efficiency Opportunity Checklist
- Appendix E: Glossary of Water Terms
