Using the TRI P2 Industry Profile
View this guide as a printable PDF factsheet
What is the TRI P2 Industry Profile?
The Toxics Release Inventory (TRI) Pollution Prevention (P2) Industry Profile is an online data visualization dashboard for exploration of industry sectors through TRI data with options to filter by location, facility, chemical, and activity. The tool may help with identification of relevant data, trends, and potential areas of concern, as well as targets for resource allocation or prioritization efforts.
The dashboard includes facility-reported data from the past 13 years (2007-2019) on releases, waste management, and source reduction, along with census demographic information to allow you to explore and connect to other resources.
How does the Profile present information?
Summary Profile View
The summary page shows four charts displaying releases by media over 13 years, aggregated releases by chemical, aggregated waste managed by state, and top 10 chemicals based on reported source reduction activities.
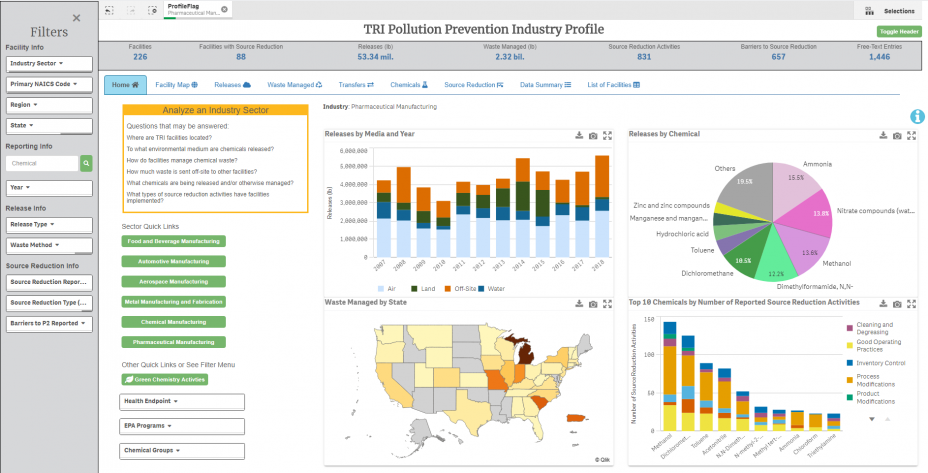
Example of Summary Profile of the Pharmaceutical Sector
In addition to the home screen, users can select one of the eight tabs containing detailed information grouped by topic, including facility maps and tables of reported source reduction activity details. The content displayed on each tab is detailed below:
Visit the full TRI Pollution Prevention Industry Profile dashboard to explore available data.
| Facility Map |
Releases |
|---|---|
 |
 |
|
|
| Waste Managed |
Transfers |
 |
 |
|
|
| Chemicals |
Source Reduction |
 |
 |
|
|
| Data Summary |
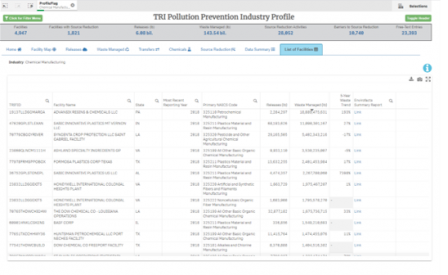
List of Facilities |
 |
 |
|
|
P2 Dashboard Information Buttons
Home: This landing screen shows a summary overview of TRI data based on search selections. Four key metrics are shown related to pollution prevention, aggregated waste management, and details on chemical releases. Use the tabs to browse through the data by topic.
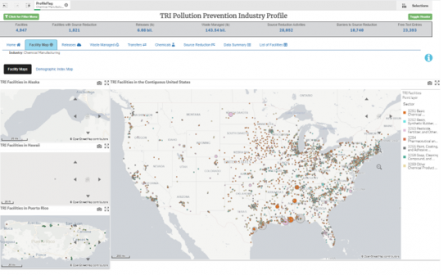
Facility Map: The Facility Map tab shows facilities reporting to TRI on a standard geopolitical map layer. By toggling to the "Demographic Index" map you can explore TRI facility locations overlaid with demographic information.
Map display:
- Each bubble shown on the map denotes a single TRI facility, color coded by industry and scaled to represent relative release quantities based on search parameters.
- For sector-specific analysis, facilities are color coded by subsector and proportionally sized based on release quantities compared to those in the sector.
Note: Facilities located in U.S. territories are not mapped.
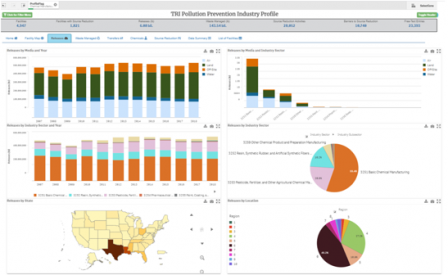
Releases: The Releases tab shows release quantities reported to TRI based on search selections. A "release" of a chemical means that it is emitted into the air or water, placed in some type of land disposal, or transferred off site to another location for disposal or release. These release quantities are estimated or measured after passing through pollution control devices (such as scrubbers and fabric filters). Total release quantities include both routine releases and accidental or non-routine release quantities.
Release types include:
- Air releases: Point sources (e.g., a smokestack) and non-point sources, such as leaks (referred to as "fugitive" emissions on the TRI reporting form).
- Water releases: Direct discharges to bodies of water, such as streams and rivers, or runoff.
- Land releases: Several types of disposal, such as disposal in landfills, in surface impoundments, and into underground injection wells.
- Off-site releases: Transfers of waste (e.g., metals and metal compounds) to Publicly Owned Treatment Works (POTWs) that are ultimately released as well as transfers to other facilities for waste disposal (e.g., landfills).
The "Release Media" menu allows filtering by aggregate media types: air, water, land, and off-site. The "Detailed Release Media" menu allows finer filtering of all release mediums available in TRI such as stack air emissions, underground injection Class I, or RCRA Subtitle C landfills.
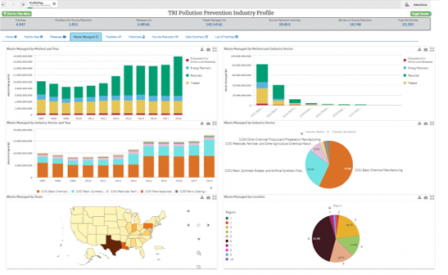
Waste Managed: The Waste Managed tab shows waste management quantities reported to TRI based on search selections. The management of chemical waste refers to methods applied on waste generated including recycling, burning for energy recovery, treatment, and disposal or otherwise released. These are production-related waste management methods occurring at the reporting facility or at an off-site facility.
Waste management methods include:
- Recycling: The recovery of a toxic chemical in waste for reuse.
- Energy recovery: The combustion of toxic chemicals in waste to generate heat or electricity.
- Treatment: The destruction of a toxic chemical in waste.
- Disposal or other releases: Toxic chemical quantities entering the environment.
The "Waste Management Method" menu allows for filtering of the aggregate methods while the "Detailed Waste Management Methods" menu allows filtering by on-site or off-site waste management activities. For example, you may filter for only the recycling occurring on site at the reporting facility.
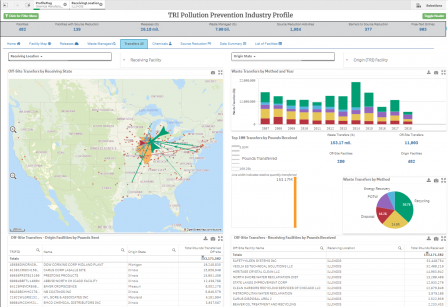
Transfers: The Transfers tab shows waste transfer information reported to TRI based on search selections. The receiving facility is identified as either a publicly owned treatment works (POTW) or another off-site location. Facilities reporting to TRI that transfer waste indicate in their forms the name and location of the receiving facility and the intended waste management method generally categorized as recycling, energy recovery, treatment, and disposal.
The "Waste Transfer Type" menu allows filtering for transfers to POTWs or transfers to other facilities by management methods.
The "Detailed Waste Transfer Type" menu allows finer filtering of POTW transfers for metals and non-metals and other facility transfer method types available in TRI such as transfers to waste brokers, incineration/thermal heat, and solvents/organics recovery.
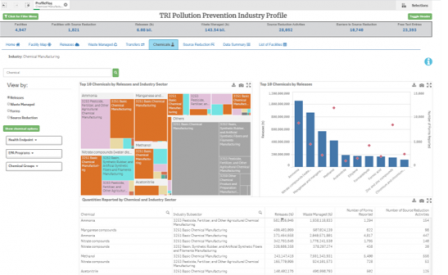
Chemicals: The Chemicals tab shows chemical information based on aggregated TRI data reported. The charts show the TRI chemicals associated with the highest quantities of reported total releases, total waste managed, total number of certified submissions (Form Rs and As), and total number of source reduction activities. Grouped by chemical, the table presents totals for these measures. The primary industry reporting the chemical information is also indicated.
The "Open Chemical Filter" menu allows for searching by synonyms, abbreviations, or other common names. The "Show Chemical Options" button allows filtering of TRI chemicals to those associated with potential health points, regulated by other EPA programs (e.g., hazardous air pollutants (HAPs) and TSCA workplan chemicals), and classified by function or type such as solvents, PBTs, or metals.
Source Reduction: The Source Reduction tab shows source reduction information reported to TRI based on search parameters. Source reduction refers to how facilities reduce the amount of chemical waste they produce or how they avoid creating it in the first place.
Facilities report new source reduction activities implemented during the reporting year. These activities are grouped in eight different categories (e.g., raw material modifications). The "Source Reduction Activity" menu allows for filtering of specific activities ("W codes"). Certain codes correspond to green chemistry activities; clicking on the green leaf icon limits results to these activities.
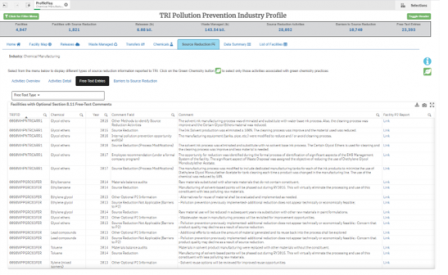
Facilities may also provide optional free-text to further describe the implemented source reduction activities or other environmental practices. In addition, facilities may report on any barriers to source reduction.
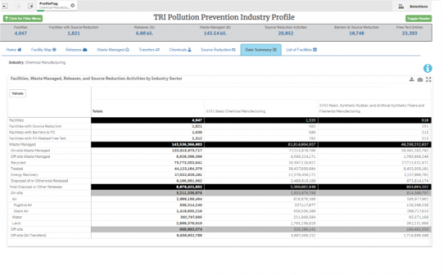
Data Summary: The Data Summary tab provides a summary of the number of facilities, waste managed quantities, release quantities, and source reduction activities by industry sector based on selections.
List of Facilities: The Facility List tab lists the facilities based on search selections. The table includes identification information for each facility as well as quantitative data such as total releases and waste managed totals.
The 5-Year Waste Trend metric presents a 3-year rolling average of waste managed based on facility-reported chemicals included in the current selection.
A link is included to Envirofacts Summary Report which lists EPA regulatory program information such as air quality, waste, and compliance reporting.
Data Source: Search results are based on TRI data from reporting years 2007 through 2019. EPA last updated these data in October 2020. TRI facility locations are based on records contained in EPA's Facility Registry Services (FRS).
