WATERS GeoViewer Tutorial
- Description
- Displaying Feature Layers and Attributes
- Upstream/Downstream Search
- Watershed Delineation
- Watershed Report
- Usage Notes
- Glossary
Description
The EPA Office of Water’s Watershed Assessment, Tracking and Environmental Results System (WATERS) integrates water-related information by linking it to the NHDPlus stream network. The National Hydrography Dataset Plus (NHDPlus) provides the underlying geospatial hydrologic framework that supports a variety of network-based capabilities including upstream/downstream search and watershed delineation. The WATERS GeoViewer provides easy access to these data and capabilities via the Internet on any desktop or mobile device using a supported web browser. It implements the concepts and principles of the Open Water Data Initiative,Exit including the hydrologic Network Linked Data Index.Exit
Let’s work through a typical water quality scenario to demonstrate how WATERS and the GeoViewer work. In our scenario, a water-quality impairment has been identified and an analyst is tasked with examining the potential source(s) contributing to the impairment.
We’re assuming that you’re already familiar with web mapping applications including legends, feature layers, zooming, panning, popup windows, etc. Note that the ESRI ArcGIS Online general purpose map template we’re using for the WATERS GeoViewer provides additional functionality that we won’t be covering in this simple tutorial.
Displaying Feature Layers and Attributes
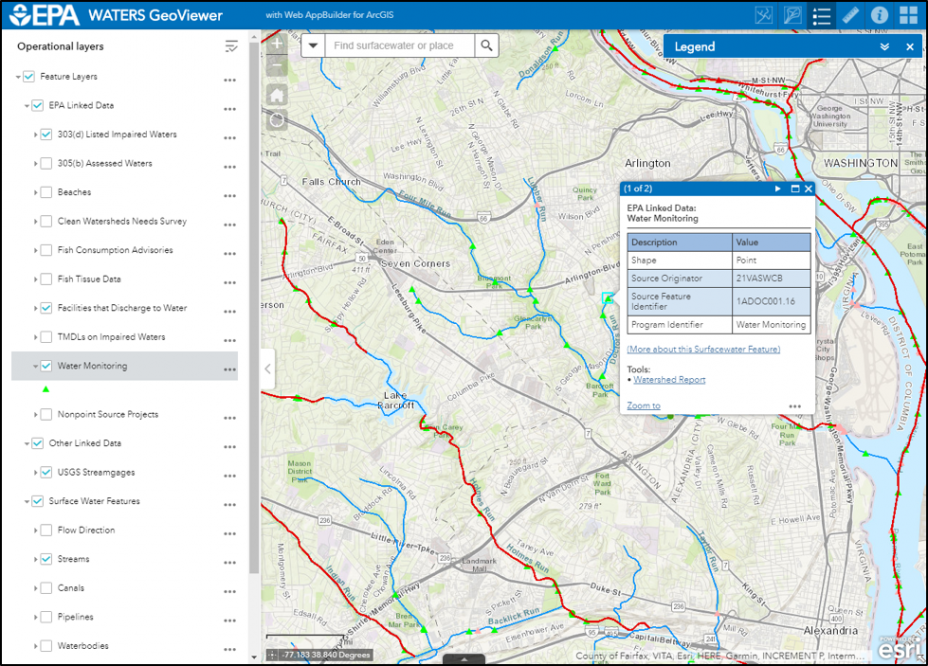
First, open the WATERS GeoViewer and, using the Find tool at the top of the map, zoom to ‘Four Mile Run’ in Arlington, Virginia just southwest of Washington, DC as shown on the map (Figure 1).
Expand the Operational Layers menu on the left by clicking on the arrow icon next to the Feature Layers item underneath. The Operational Layers menu is where you select which feature layers to display on the map. Note that in order to display a specific layer that all parent layers above it must also be selected. All feature layers selected for display along with their symbology, can be viewed by clicking on the Legend control on the right side of the map menu bar (![]() ). All six of the map controls found there, open menus that can be scrolled up to maximize the map area by clicking on their double arrow icon (
). All six of the map controls found there, open menus that can be scrolled up to maximize the map area by clicking on their double arrow icon (![]() ). You can also hide the Operational Layers menu in order to maximize the map area by clicking on the white tab with an arrowhead icon (<) half way down on the menu’s right side. Give these a try to see how they work.
). You can also hide the Operational Layers menu in order to maximize the map area by clicking on the white tab with an arrowhead icon (<) half way down on the menu’s right side. Give these a try to see how they work.
Expand the EPA Linked Data item and select it for display by clicking on the preceding check box.
Select Monitoring Locations under EPA Linked Data for display. Expand the Monitoring Locations item and the bright green triangle symbols used for map display will be shown below. Any monitoring locations that exist in the map window will appear as bright green triangle symbols. Click on one of the bright green triangles on the map to display the popup window describing that particular monitoring location (Figure 1). Click on the More About link in the popup window to access a standard data report from the STORET Water Quality System.
If other map features exist at the same map location, the popup window heading will show the number of popups available and which one of those is currently displayed, eg, (1 of 2). Click on the white arrow(s) on right side of the popup window heading to step forward or backwards through the set of popups to display the one describing the Monitoring Location.
Now select Facilities that Discharge to Water from the Operational Layers menu for display and click on one of the pink triangles on the map. Click on the More About link to access a standard data report from the Enforcement Compliance History Online (ECHO) system.
Next select 303(d) Listed Impaired Waters and click on the More About link to access a standard data report from the Assessment and Total Maximum Daily Load (TMDL) Tracking and Implementation System (ATTAINS). Back to our scenario, note the 303(d) Listed Impaired Water near the mouth of Four Mile Run in Arlington where it flows into the Potomac River.
Finally, select USGS Streamgages and click on the More About link to access a standard data report from the USGS National Water Quality Information System (NWIS). In the Available Data table, click on the ‘Current / Historical Observations’ link to display data tables and graphs of data collected at that streamgage.
Upstream/Downstream Search
Now that we’ve seen all of the Monitoring Locations, Facilities that Discharge to Water, 303(d) Listed Impaired Waters, and Streamgages in the area, let’s select just the Monitoring Locations, Facilities, and Streagages upstream from the Impaired Water located at the mouth of Four Mile Run.
First, un-select the Monitoring Locations, Facilities that Discharge to Water, 303(d) Listed Impaired Waters and Streamgages on the Operational Layers menu.
Click on the Network Search icon (![]() ) on the map menu bar at the top of the page. The Upstream/Downstream Search menu will appear on the right. Note that you’re under the Input tab.
) on the map menu bar at the top of the page. The Upstream/Downstream Search menu will appear on the right. Note that you’re under the Input tab.
Pan and zoom the map if needed so Four Mile Run is fully visible.
Select ‘Upstream with Tributaries’ from the Stream Selection Type dropdown pick list.
Select the starting point for the search by first clicking on the white button (containing the GPS icon ![]() ) in the menu and then clicking on the desired map location. A green push pin will appear at that point on the map. You can click on the red button (containing the trash can icon
) in the menu and then clicking on the desired map location. A green push pin will appear at that point on the map. You can click on the red button (containing the trash can icon ![]() ) to delete the existing starting point from the map.
) to delete the existing starting point from the map.
Next specify the Maximum Distance for the search as 25 km (far enough upstream to include the headwaters) and check the individual linked data features that you’d like to search for.
Click the Execute button at the bottom of the menu to run the search. You may need to scroll down to make the Execute button visible.
While the search is executing a row of pulsating dots is displayed under the Output tab along with a scrolling list of text which you can ignore (it’s techno garble that unfortunately we can’t hide). When the search is finished, some basic results are displayed under the Output tab. The results are also displayed on the map and added to the top of the Operational Layer list (Figure 2). The map extent is updated to display the results. The streams that were searched are displayed in yellow and the requested features linked to those streams are displayed with their regular symbols and colors. You’ll see that the entire stream segment you clicked on is included in the results.
See the Usage Notes section below for instructions on how to download the results and to access metadata.
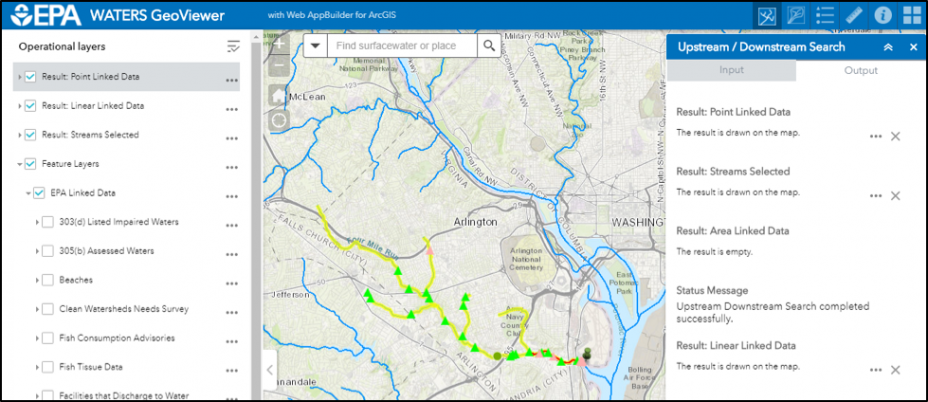
Note that expanding the Point, Line and Polygon result items on the Operational Layers menu will display all possible linked data symbols and names and not just those selected during the search. (This is a shortcoming of the underlying ArcGIS Online toolset.)
The results from the last Upstream/Downstream Search remain on the map and in the Operational Layers list unless you delete (clear) them under the Output tab by clicking on the X icon on the right.
Watershed Delineation
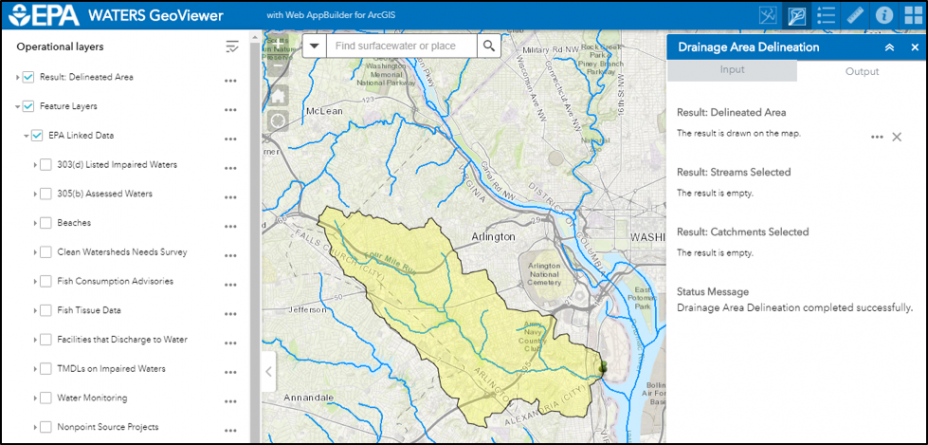
Now that we’ve selected the Monitoring Locations and Facilities upstream from the Impaired Water at the mouth of Four Mile Run, let’s delineate the associated watershed from the Impaired Water all the way to the headwaters. A drainage area defines the geographic extent of the land surface that drains to a specific point (the outlet). A watershed is a special kind of drainage area that extends from the starting point (the outlet) upstream all the way to the headwaters.
Click on the Drainage Area Delineation icon (![]() ) on the map menu bar at the top of the page. The Drainage Area Delineation menu will appear. Note that you’re under the Input tab.
) on the map menu bar at the top of the page. The Drainage Area Delineation menu will appear. Note that you’re under the Input tab.
Pan and zoom the map if needed so Four Mile Run is fully visible.
Select ‘Upstream with Tributaries’ from the Stream Selection Type dropdown pick list.
Select the starting point for the delineation by first clicking on the white button (containing the GPS icon) in the menu and then clicking on the desired map location. A green push pin will appear at that point on the map. You can click on the red button (containing the trash can icon) to delete the existing starting point from the map.
Next specify the Maximum Distance for the search as 25 km. This is far enough upstream to include the headwaters for the Four Mile Run watershed.
Click the Execute button at the bottom of the menu to delineate the watershed. You may need to scroll down to make the Execute button visible.
While the delineation is executing a row of pulsating dots is displayed under the Output tab along with a scrolling list of text which you can ignore (it’s techno garble that unfortunately we can’t hide). When the delineation is finished, some basic results are displayed under the Output tab. The results are also displayed on the map and added to the top of the Operational Layer list (Figure 3). The watershed is displayed in solid yellow with a black border. You’ll see that the entire stream segment you clicked on is included in the results.
See the Usage Notes section below for instructions on how to download the results and to access metadata.
The results from the last Drainage Area Delineation remain on the map and in the Operational Layers list unless you delete (clear) them under the Output tab.
Watershed Report
Now let’s produce a report of characteristics describing the full watershed we just delineated.
Just click on the same location as the watershed starting point above (no menus are needed for this tool).
Recall from the section above on Displaying Features Layers and Attributes that if other map features exist at the same location, the popup window heading will show the number of popups available and which one of those is currently displayed, eg, (1 of 2). Click on the white arrow(s) on right side of the popup window heading to step forward or backwards through the set of popups to display the one describing the Streams Surfacewater Feature.
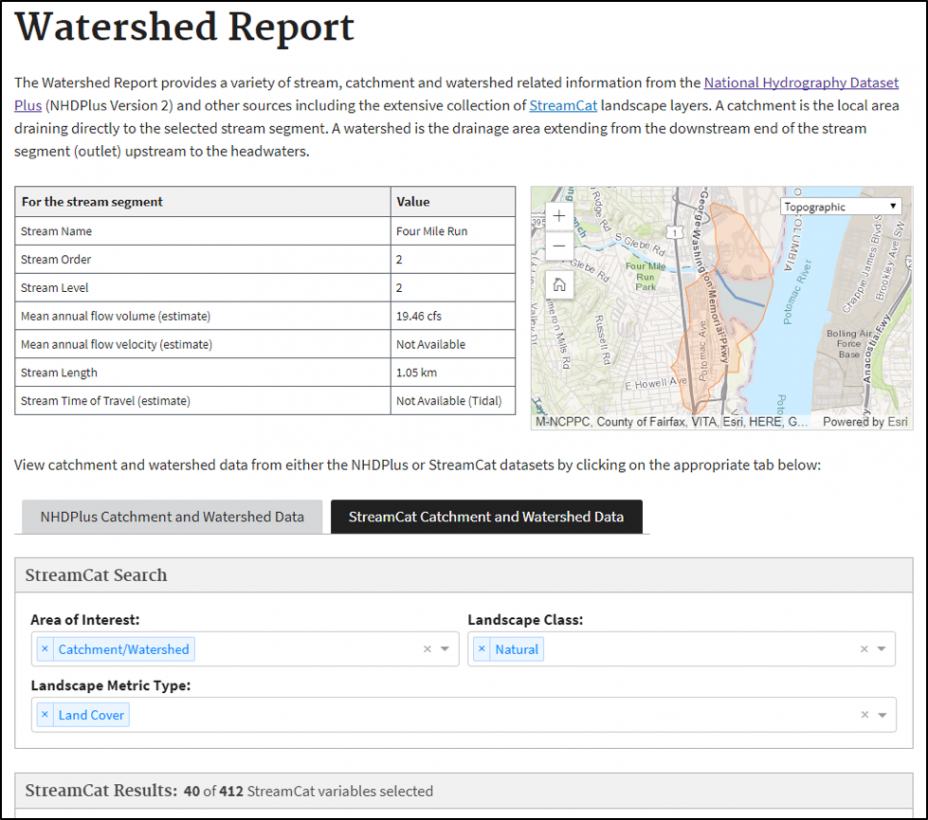
Clicking on the Watershed Report link will open a new window displaying a report containing information on the stream segment, catchment and watershed associated with the map location you clicked on (Figure 4). The small inset map displays the stream segment and catchment.
Click on the StreamCat Catchment and Watershed Data tab, then under StreamCat Search specify the following selection criteria:
- Area of Interest = Catchment/Watershed
- Landscape Class = Natural
- Landscape Metric Type = Land Cover
to display the available landscape variables from the National Land Cover Dataset (NLCD) in the Search Results table that follows.
The complete Watershed Report can be downloaded in JSON format (.json) and its StreamCat content can be downloaded in comma-separated-values format (.csv) by clicking on the buttons at the bottom of the report.
Back to our scenario, in just a few minutes our analyst is now equipped for his search for potential impairment source(s) with ambient monitoring and facility-related water quality data as well as a rich collection of stream, catchment and watershed attributes from upstream including the contributing landscape.
Usage Notes
- Supported web browsers can be found at https://doc.arcgis.com/en/arcgis-online/reference/browsers.htm.
- The individual result layers can be downloaded from under the Output tab by clicking on the three dot icon (…) to the right of each layer and then selecting the desired export format. We plan to improve the current output attribute labeling, which is the ArcGIS Online default, in the near future.
- If you’re a QGIS user, select Export to GeoJSON to create a file on your PC, then cut-and-paste the resulting GeoJSON file contents into QGIS.
- If you’re an Esri Desktop GIS user (ArcGIS Desktop or ArcGIS Pro), then select Export to Feature Collection to create a file on your PC and use the JSON to Features geoprocessing tool to import the JSON into a feature class.
- If you’re an Esri Web GIS user with a valid ArcGIS Online account, it is possible to save results directly into your ArcGIS Online workspace, from where it can be converted to a hosted layer and/or exported in a variety of formats including shapefile, CSV, KML, Excel, FGDB, GeoJSON and Feature Collection.
- Metadata for individual result layers is available, as follows:
- EPA Linked Data > https://edg.epa.gov/metadata/catalog/main/home.page
- Streams Selected, USGS Streamgages, Catchments Selected, Drainage Area Delineation - https://19january2021snapshot.epa.gov/waterdata/nhdplus-national-hydrography-dataset-plus#metadata
- ArcGIS Online should prompt users to log in when actions require credentialed usage (e.g. such as saving results to your account). If this process does not occur or presents errors then one solution is to enter the GeoViewer via the landing page here > https://www.arcgis.com/home/item.html?id=ada349b90c26496ea52aab66a092593b. After arriving verify you are logged into the desired ArcGIS Online account and from there open the WATERS GeoViewer by clicking the View Application button.
- The more information you display on the map, the longer it will take the map to draw. You can control this to some extent by zooming in so there are fewer features to be displayed in the map window and by being conscious about un-selecting items when you don't need to display them anymore - such as when you are zooming back out.
- ArcGIS Online decides whether to display popups as small windows on the map or in a separate browser window based upon its assessment of available space on the screen.
- When ‘click location’ is near but not right on a stream, the closest stream is used.
- Point and Linear Linked Data features are associated with single locations and sections of streams, canals, pipelines, etc. Area Linked Data features are associated with parts of lakes, ponds, etc.
- Only the last Upstream/Downstream Search and Drainage Area Delineation results are displayed. The previous versions are automatically deleted.
- You can re-use the same starting point for Upstream/Downstream Search or Drainage Area Delineation and only change the search or delineation parameters.
- ArcGIS Online as well as the general purpose map template we’re using for the WATERS GeoViewer impose some limitations in terminology and ease of use. We welcome your comments and feedback on how to make the WATERS GeoViewer more useful, which can be submitted through the Contact Us link at the bottom of the page.
Glossary
Catchment – the local drainage area for a specific stream segment found it National Hydrography Dataset Plus. NHDPlus catchments are 1-2 square miles in area on average. Note that approximately half of all catchments are watersheds; specifically, those that contain a headwater stream segment.
Hydrologic Unit – a hydrologically-derived area defined with the Watershed Boundary Dataset. Hydrologic Units are organized into six levels that are similar in size within each level.
National Hydrography Dataset (NHD) – a national geospatial set of surfacewater features which provides a stream addressing system and drainage network relationships that enable upstream and downstream queries of related water information. These features include streams, canals, pipelines, waterbodies and coastlines.
National Hydrography Dataset Plus (NHDPlus) – a suite of geospatial products resulting from the integration of the National Hydrography Dataset (1:100,000-scale), the Watershed Boundary Dataset (for the 10 states where it existed in 2005), and the National Elevation Dataset (30M) that includes catchments, stream order, stream flow volume and velocity.
Watershed – the area that drains to a specific location on the landscape, extending upstream to include the headwaters.
Watershed Boundary Dataset (WBD) – a national geospatial set of hydrologic units organized into six levels of hydrologically-defined areas that are similar in size within each level. Note that approximately half of all hydrologic units are watersheds; specifically, those that extend upstream to include headwaters.