Data and Information Used by WaterSense
 In carrying out the program, WaterSense strives to use up to date and comprehensive data sources. WaterSense also works to make information easy to understand so that the program, its partners and stakeholders, and the public can recognize the impact of specific choices and technologies.
Often the program will reference several different data sources to support a single estimate or figure. The program frequently fields questions about these numbers (interested parties are welcome to do so by contacting the WaterSense helpline). WaterSense is providing the following references for interested parties that would like to know more about data sources frequently used by the program.
On this page
- Estimating WaterSense Accomplishments
- Total Water Withdrawals and Total Per Capita Water Use
- Embedded Energy in Water and Wastewater
- National Building Stock and Energy Use
- End Uses of Water
- Cost of Water
- Savings from Avoided Water Heating
- Additional Resources for Data Used by WaterSense
Estimating WaterSense Accomplishments
WaterSense annually releases a report that estimates the water, energy, and utility bill savings derived from the use of WaterSense products. Those interested in learning more about how WaterSense estimates its annual and cumulative program savings can review:
- A summary of the overall approach
- A detailed report on the methodologyExit
- Annual Accomplishments Reports
Other data products, sources, and calculations listed on this page are also used in calculating accomplishment estimates.
Total Water Withdrawals and Total Per Capita Water Use
The U.S. Geological Survey (USGS) National Water Information System provides the most consistent picture of total water withdrawalsExit and use on a national or state level, as well as water use on a per capita (i.e., person) basis. The USGS has conducted a national assessment of water use every five years since 1950.
- USGS Water Use Data for the NationExit
- Water Use in the United States – includes links to reports and data visualizationsExit
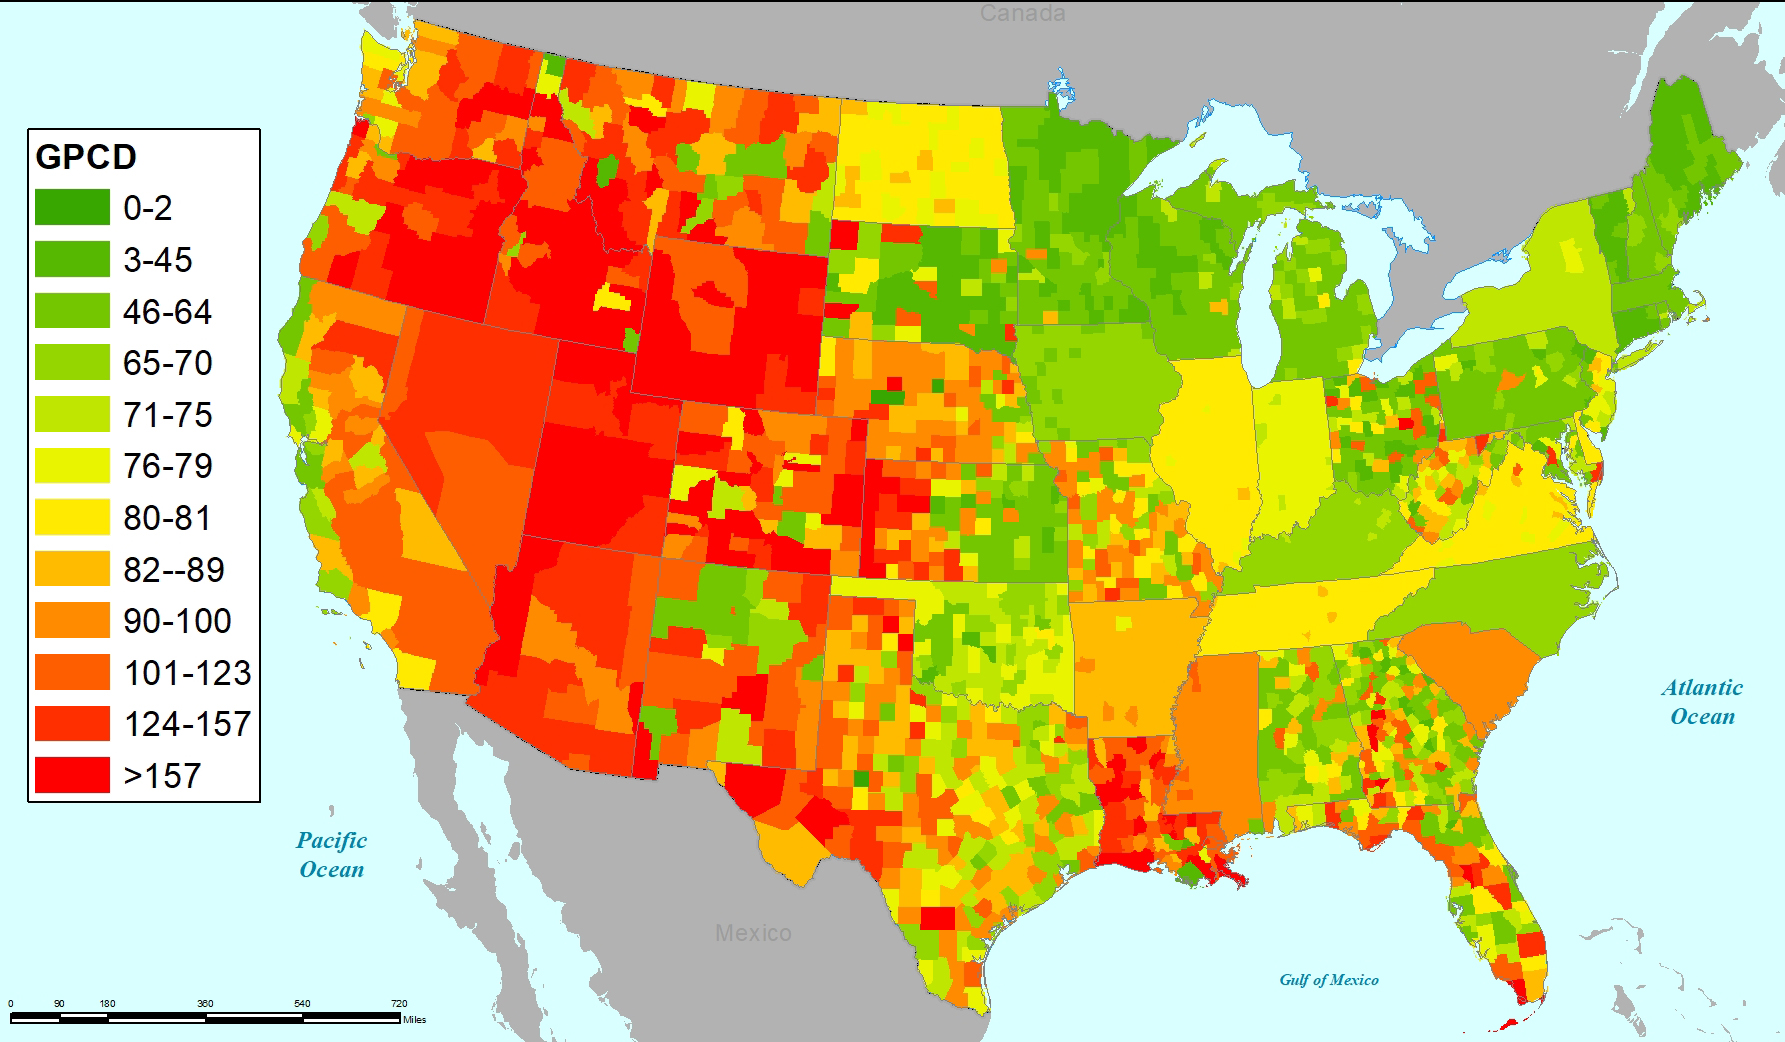
The figure below presents USGS data from the 2015 report highlighting domestic water use by county on a gallons per capita per day (GPCD) basis.
Embedded Energy in Water and Wastewater
Delivering safe water and collecting and treating wastewater consumes substantial energy nationwide. Saving water also reduces the energy needed by the water and wastewater industries. WaterSense uses information from the Electric Power Research Institute (EPRI) to inform the energy use associated with providing drinking water and wastewater services.
- Electricity Use and Management in the Municipal Water Supply and Wastewater Industries, EPRI, 2013Exit
- WaterSense uses the report to estimate the use of energy to move and treat water for public uses.
|
Service |
kWh/1,000 gallons water processed |
|---|---|
| Drinking Water | 2.069 |
| Wastewater | 2.521 |
National Building Stock and Energy Use
While data products on national water use are relatively limited in the U.S., there is a wealth of data on energy use, building information, and demographic data that can be informative to understanding water use. These include the following:
| Data Source | Agency | Data Included |
|---|---|---|
| American Community Survey (ACS)Exit | U.S. Census Bureau | Demographic information on a relatively granular scale |
| American Housing Survey (AHS)Exit | U.S. Census Bureau | Building stock, design, and technology information for homes |
| Census Bureau Housing DataExit | U.S. Census Bureau | Information on existing housing, new construction, and housing starts. |
| Commercial Building Energy Consumption Survey (CBECS)Exit | U.S. Energy Information Administration | Building stock information and end use energy consumption data for commercial building types |
| Residential Energy Consumption Survey (RECS)Exit | U.S. Energy Information Administration | Building stock information and end use energy consumption data for commercial building types |
End Uses of Water
 The Water Research Foundation (WRF) has supported studies that assess how water is used in homes. The first study was conducted in the late 1990’s and an update was released in 2016.
WaterSense also seeks field data on water use in the commercial and institutional sectors and makes this information available on our website. Because there is no one source for this type of information, the program often pulls data from different sources to develop its information. For example, the graphic below from our WaterSense at Work guide was developed by reviewing data from the following sources:
- A Water Conservation Guide for Commercial, Institutional and Industrial Water Users, Prepared for the New Mexico Office of the State Engineer, July 1999Exit
- Commercial and Institutional End Uses of Water, Dziegielewski, Benedykt, et al. American Water Works Association (AWWA) and AWWA Research Foundation. 2000Exit
- WaterSmart Guidebook: A Water-Use Efficiency Plan Review Guide for New Businesses, East Bay Municipal Utility District, 2008Exit
- Helping Businesses Manage Water Use—A Guide for Water Utilities, American Water Works Association, 1993Exit

Cost of Water
WaterSense annually estimates the average cost of water and wastewater in the U.S. based on an analysis of data from rate surveys conducted by the American Water Works Association. For those years when data from the AWWA survey is not available, WaterSense adjusts the average cost to the current year using the Gross Domestic Product (GDP) deflator for water from the U.S. Department of Commerce Bureau of Economic Analysis. A detailed explanation of this approach has been published by the Lawrence Berkeley National Lab (LBNL).
- American Water Works Association’s (AWWA) Rate SurveyExit
- LBNL – Keeping Pace with Water and Wastewater RatesExit
| Customer Type | Cost per 1,000 gallons Water | Cost per 1,000 gallons Wastewater | Combined Water & Wastewater/1,000 gallons |
|---|---|---|---|
| Residential | $5.07 | $6.41 | $11.48 |
| Commercial | $4.13 | $5.60 | $9.73 |
Savings from Avoided Water Heating
When hot water using products use less water, they also reduce the energy needed to heat water. To give a complete picture of the savings associated with water-efficiency, WaterSense calculates the energy and utility bill savings attributable to abated (i.e., avoided) water heating. This estimate involves numerous data points that are updated annually (or as frequently as possible given the source data). WaterSense worked with the Lawrence Berkeley National Laboratory to develop a methodology to carry out the analyses used to estimate energy savings in the program’s annual accomplishments.
- LBNL - Calculating average hot water mixes of residential plumbing fixturesExit
- WaterSense Methodology and Assumptions for Annual Accomplishments
For 2019, key data points used in this estimate (by Census region) are in the graphic and table below.
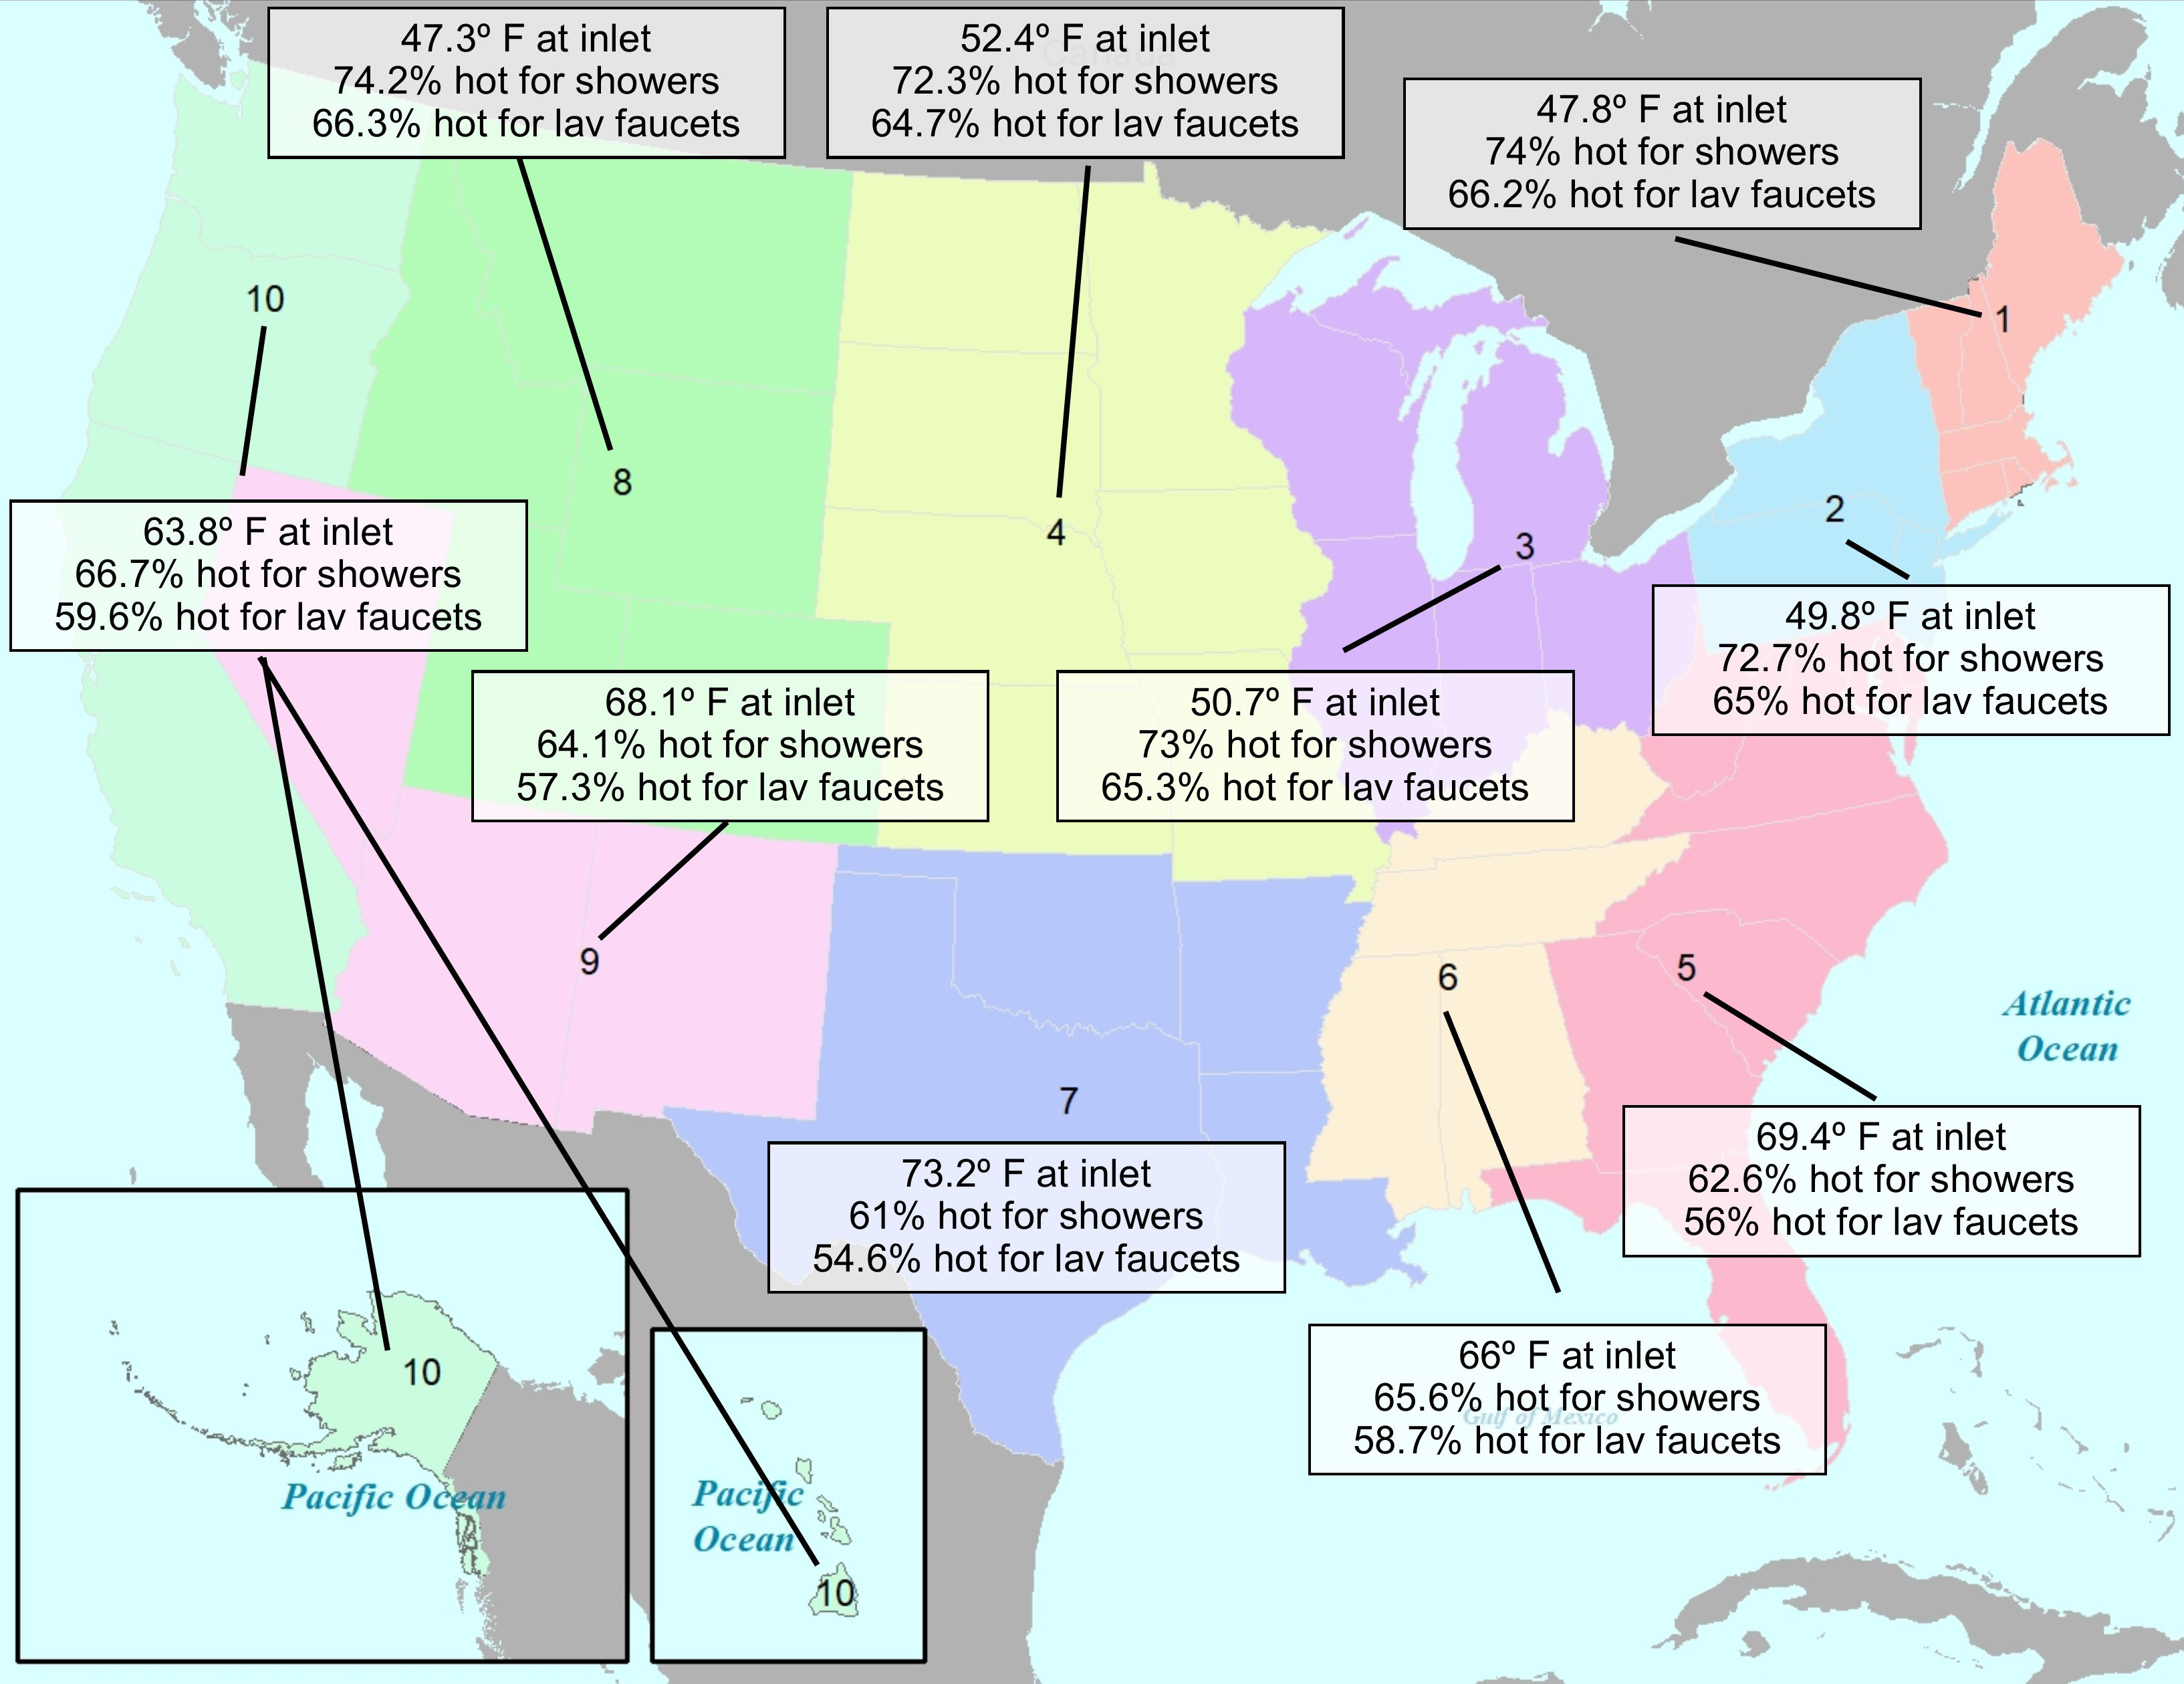
| Census Region | Average Inlet Water Temperature (ºF) | Average Temperature Rise at the Water Heater (ºF) | Average % of Shower Water that is Hot | Average % of Lavatory Faucet Water that is Hot |
|---|---|---|---|---|
| Weighted National Average | 60.5 | 64.5 | 67.8 | 60.7 |
| 1 | 47.8 | 77.2 | 74.0 | 66.2 |
| 2 | 51.4 | 73.6 | 72.7 | 65.0 |
| 3 | 50.7 | 74.3 | 73.0 | 65.3 |
| 4 | 52.4 | 72.6 | 72.3 | 64.7 |
| 5 | 69.4 | 55.6 | 62.6 | 56.0 |
| 6 | 66.0 | 59.0 | 65.6 | 58.7 |
| 7 | 73.2 | 51.8 | 61.0 | 54.6 |
| 8 | 47.3 | 77.7 | 74.2 | 66.3 |
| 9 | 68.1 | 56.9 | 64.1 | 57.3 |
| 10 | 63.8 | 61.2 | 66.7 | 59.6 |
WaterSense estimates the efficiency of water heating technology in use on an annual basis using data from the Air Conditioning, Heating, & Refrigeration Institute (AHRI)Exit. For 2019 the values used are
| Fuel Source | Estimated Efficiency | Energy/Gallon Heated |
|---|---|---|
| Electric | .931 | 0.169514222 kWh/gallon |
| Natural Gas | .605 | 0.0008638 mcf/gallon |
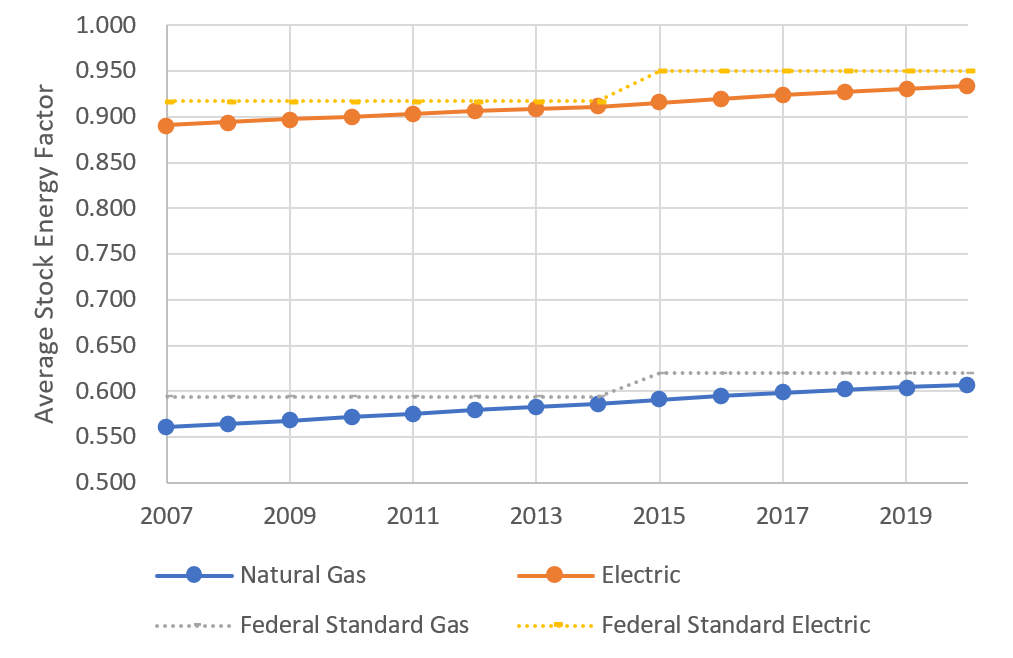
The chart below shows the estimated changes in estimated efficiency relative to federal standards since 2007.
WaterSense applies electric vs. natural gas efficiencies based on data from American Housing Survey (AHS) and Commercial Building Energy Consumption Survey (CBECS). The most recent available data is:
| Customer Type | % Electric | % Commercial |
|---|---|---|
| Residential (based on AHS) | 46.4% | 53.6% |
| Commercial (based on CBECS) | 41.8% | 58.2% |
Additional Resources for Data Used by WaterSense
- Historic Reference Evapotranspiration and Rainfall data
- WaterSense frequently uses data from the International Water Management Institute’s (IWMI) World Water & Climate AtlasExit, which is based on data collected for the period 1961-1990. While dated, the data provides a consistent national coverage for estimating these climate parameters.
- WaterSense has processed this data to provide estimates of monthly rainfall and reference evapotranspiration at the zip code level (xlsx).
- The Water Research Foundation (WRF)Exit conducts research on a number of issues related to water use, demand management, and water-efficiency
- The Alliance for Water Efficiency Exitmaintains a resource library of useful materials on water conservation and efficiency