Challenges in Predicting Smoke Concentrations
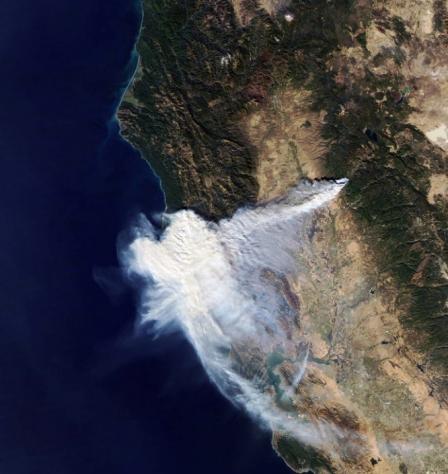
Wildfires can blanket the surrounding area with smoke, raising the level of particle pollution to unhealthy concentrations and creating an air quality concern for residents. Because smoke can travel hundreds or thousands of miles, air quality can also be a problem far from the wildfire itself. Air quality can change rapidly. Predicting if the air quality will improve or worsen can be difficult because of the unpredictable behavior of wildfires and factors such as wind, weather, and terrain. For example, a wind that usually clears out a valley could also blow more smoke in or fan the flames, intensifying the fire and worsening smoke.  Figure 3. Strong winds can cause rapid fire spread and move smoke into communities far from a wildfire. Smoke from the 2018 Camp fire caused weeks of poor air quality in the San Francisco Bay area.
The intense heat generated by an active wildfire drives smoke high into the air where it remains until it cools and begins to descend. As smoke moves downward to ground level, it becomes more diluted and often more widespread. Terrain also affects smoke concentrations. For example, as the sun warms mountain slopes, air is heated and rises, bringing smoke and fire with it from lower elevations affected by smoke. After sunlight passes, the terrain cools and the air descends, creating a down-slope airflow that can alter the smoke dispersal pattern. Daily cycles can help predict repeating patterns of smoke exposures in communities.
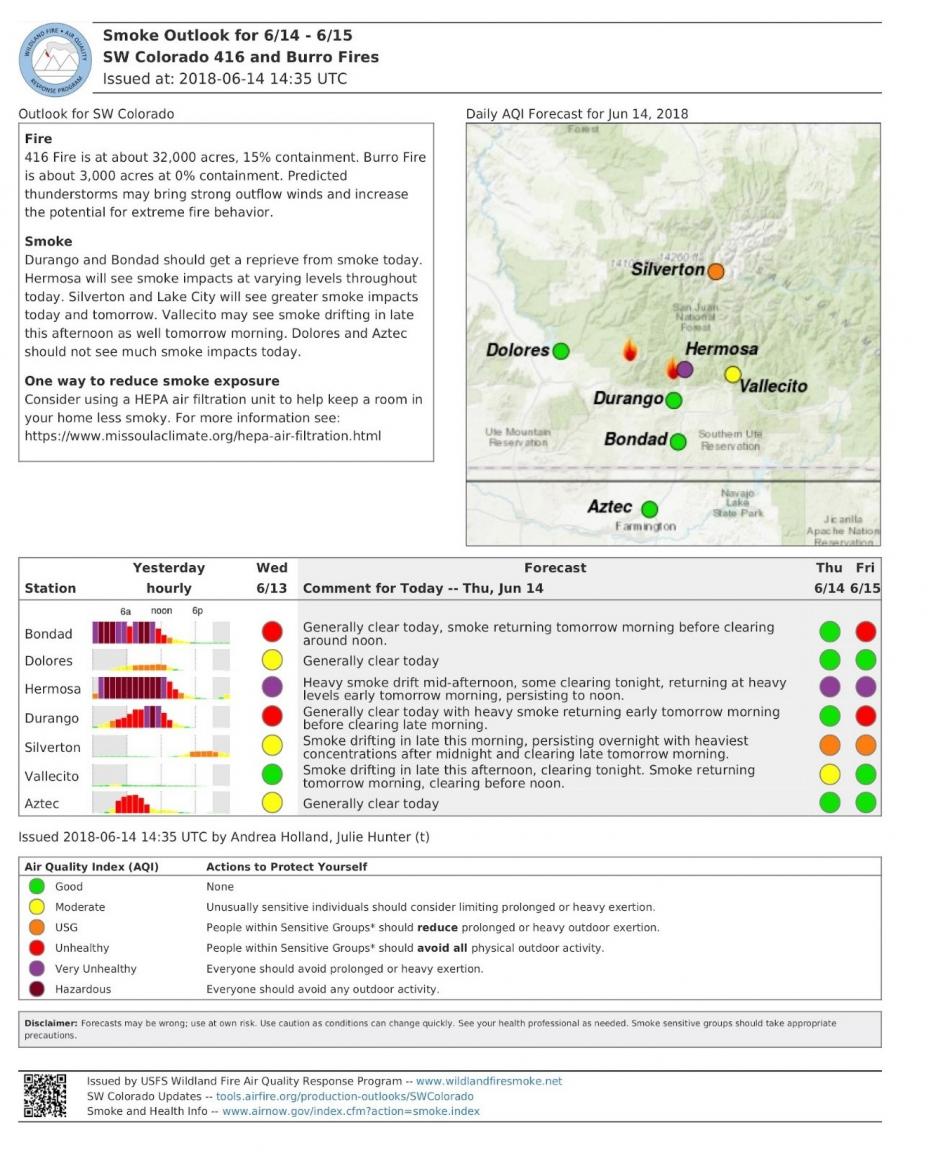
Because smoke concentrations during a wildfire are constantly changing, it’s important to check frequently for updates to smoke predictions (See Figure 4, example of smoke outlook). Near-real-time air quality data and forecasts are available to the public via AirNow.gov, including continuous particle pollution data from over 1,700 monitors, and temporary monitors that monitor smoke on an hourly basis during a wildfire. AirNow also has a Fires: Current Conditions page where the public can access current nationwide wildfire conditions, links to state advisories and smoke blogs, information about smoke and health, and a variety of external web resources pertaining to wildfires. The interactive map is a joint effort of the U.S. Forest Service, EPA, and state and local air quality agencies.
 Figure 4. Example of smoke outlook produced by an Air Resource Advisor assigned to the 416 Fire. Current smoke outlooks are available at https://wildlandfiresmoke.net/outlooks.
