Wildfire Smoke and Your Patients' Health: The Air Quality Index
This section of the course covers the following topics:
- Health-Based Categories of Air Quality
- Where to Find Air Quality Reports
- Daily Activities Using the AQI
Health-Based Categories of Air Quality
Air agencies across the U.S. use the Air Quality Index (AQI) to communicate about air quality. The AQI is a nationally uniform color-coded index developed by EPA for reporting and forecasting daily air quality. The AQI reports the most common ambient air pollutants that are regulated under the Clean Air Act, including ozone and particle pollution (PM10 and PM2.5). The AQI informs the public about air quality in the area, tells who may be affected, and provides steps to take to reduce exposure when pollution levels are unhealthy.
The AQI focuses on health effects that may be experienced within hours or days after exposure to polluted air. It uses a normalized scale from 0 to 500: the higher the AQI value, the greater the level of pollution and the greater the health concern. An AQI value of 100 generally corresponds to the level of the daily National Ambient Air Quality Standard for the pollutant. AQI values at and below 100 are generally considered to be satisfactory. When AQI values are above 100, air quality is unhealthy, at first for sensitive groups at greatest risk of a health effect, then for the entire population as AQI values get higher.
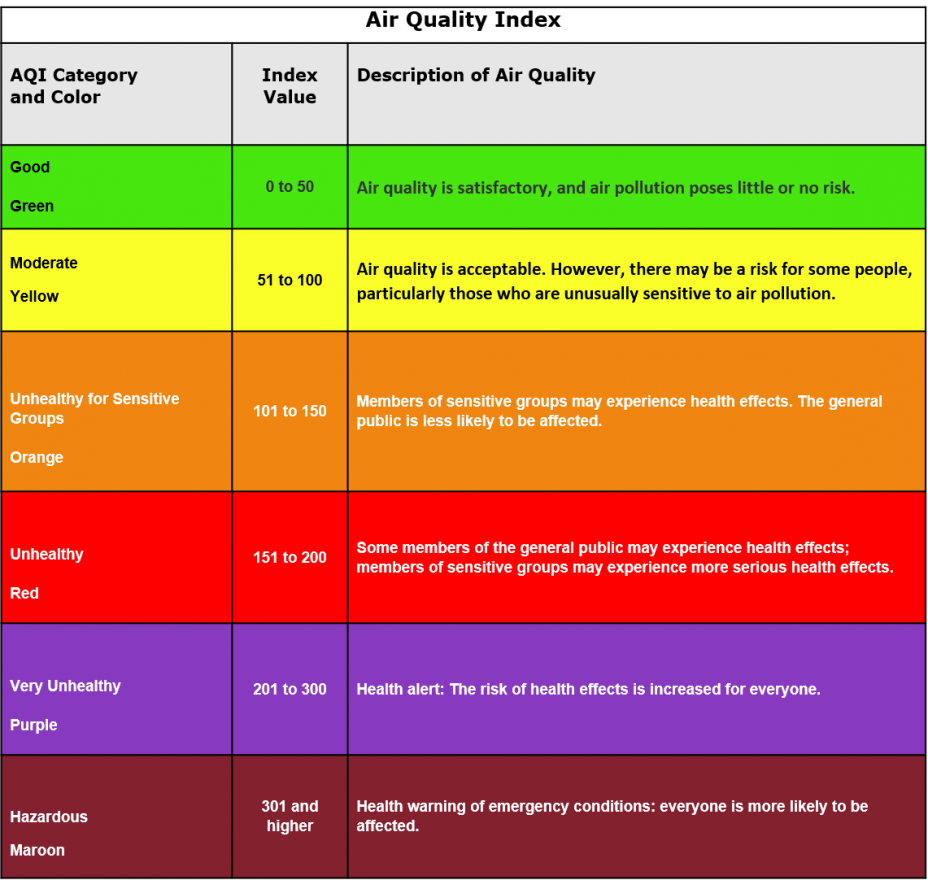
The AQI is divided into six categories that correspond to different levels of health concern. The breakpoints between these categories are selected based on a review of the health effects evidence. Each category has a specific color that makes it easy for people to know when air quality is reaching unhealthy levels in their communities.
 Table 2. The Air Quality Index includes AQI categories and colors, corresponding index values and cautionary statements for different levels of health concern.
Where to Find Air Quality Reports
In many areas, the local media—newspapers, television, and radio—provide air quality reports telling the public when pollution levels are predicted to be unhealthy. These reports generally appear with the weather forecast. Some national media (e.g., USA Today, The Weather Channel, and CNN) also provide daily air quality reports. Information is also shared via social media.
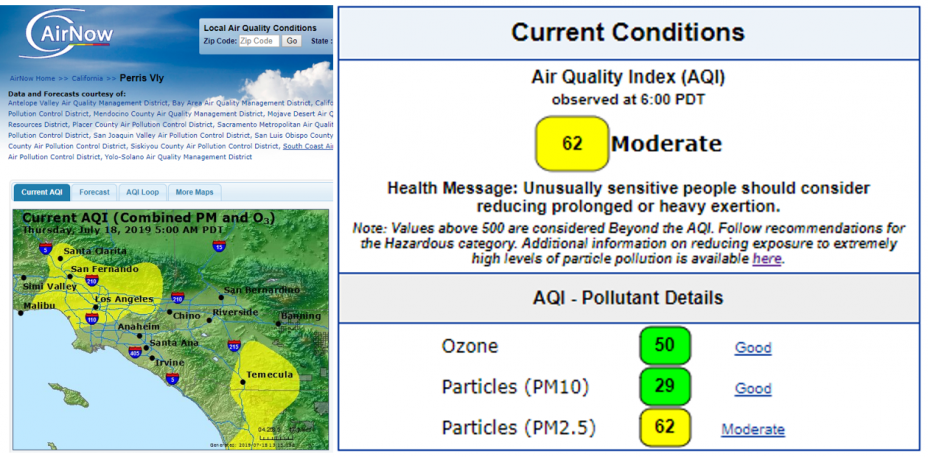
AirNow.gov has current and forecast air quality data and maps. In many areas, residents can sign up to get email notices about air quality through a free service called EnviroFlash. Some state, local, and tribal air agency websites also show the AQI.
 Figure 7. Sample AirNow current air quality data, map, and AQI values
Note that there are new and emerging methods of reporting air quality, including lower-cost sensor technologies that provide real-time measurements and air quality models that can estimate concentrations in locations without nearby monitors. While the availability of sensor measurements and air quality model estimates can increase the amount of information to the public during a smoke event, the accuracy, precision and reliability of some types of reported air quality data are still being evaluated. If you see conflicting air quality reports during a wildfire, contact your local government air agency for advice.
Daily Activities Using the AQI
The goal of AQI advisories is to help people reduce their inhaled dose of air pollution when air pollution levels are high. The inhaled dose is approximately equal to the product of the ambient concentration, the minute ventilation (breathing rate), and duration of the exposure in minutes.
Dose ≈ ambient concentration (µg/m3) X minute ventilation (L/min) X duration exposure (min).
Reducing any of the three factors will lower the inhaled dose. AQI advisories inform the public how to reduce concentration (e.g., be active outdoors when air quality is better), the minute ventilation (e.g., go for a walk instead of a jog) or the duration of the exposure (e.g., spend less time engaged in outdoor exertion).
- Check the AQI forecast to plan their day,
- Pay attention to current air quality conditions (NowCast AQI) before they go outside, and
- Use common sense to reduce smoke exposure.
- Check the AQI forecast: The AQI forecast will tell you what the air quality is expected to be, which groups of people may be affected, and steps individuals can take to reduce their exposure to air pollution. Forecasts for the next day are usually issued in the afternoon. Many forecasters also provide a daily “forecast discussion,” which tells you when pollution is expected to be highest – and if there are times when air quality is expected to be better. Some areas issue AQI forecasts for several days. Checking the forecast is important for planning purposes. Because smoke levels often change substantially over the course of the day, air quality forecasts can give information about the times of day that are expected to be less smoky. These forecasts help people plan necessary activities (e.g., trips to the store) when air quality is better.
- Pay attention to current air quality: The AirNow website shows current air quality using the NowCast AQI, an algorithm that calculates an AQI value from multiple hours of past data. When air quality is changing quickly, such as during a wildfire, the NowCast calculation adjusts by averaging fewer hours so it can adjust to rapidly changing conditions. Check current air quality (NowCast AQI) before going outside – it may be better to wait for air quality to improve before doing outdoor activities. The NowCast AQI can tell people if they should limit their activities and how to do so.
- Use common sense: Symptoms such as coughing, wheezing or shortness of breath are a sign to immediately reduce exposure to smoke. If it looks or smells smoky outside, try to stay indoors or find a cleaner air shelter. Avoid strenuous activities such as mowing the lawn or going for a run.
