Providing Evidence of Water Quality Improvements in Ohio
Program Overview
Ohio uses numeric biocriteria in its Water Quality Standards. The criteria are based on stream fish assemblages (Index of Biotic Integrity, IBI, and the Modified Index of Well-Being, MIwb) and stream macroinvertebrate assemblages (Invertebrate Community Index, ICI). Criteria for each biological index are specified for each of Ohio's five ecoregions and are used in conjunction with chemical and whole effluent toxicity evaluation methods and criteria to monitor and assess the condition of the state's surface waters.
The results of bioassessment support a variety of resource management activities in Ohio, including Section 305b reports, water quality standards and use attainment/non-attainment status, nonpoint source assessment and management, dredge-and-fill (401 Certifications), NPDES permitting, and risk assessment to aquatic life from hazardous waste sites. Agencies other than the Ohio EPA have used bioassessment data and biocriteria to assist with management of rare, threatened, and endangered species; scenic river designations; environmental impact assessment; and fisheries management.
Analysis of Trends Over Time
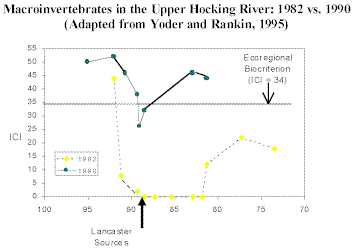
 By reviewing bioassessment data collected over time, the Ohio EPA has been able to demonstrate improved stream quality as a result of actions taken to reduce pollutant loadings. This has been done for individual river systems, as well as on a statewide basis. For example, the upper Hocking River has historically been one of the most polluted rivers in the state, with significant impacts by industrial and municipal effluents as well as combined sewer overflows. Studies indicated serious degradation for 20 miles downstream of the Lancaster WWTP, with an average macroinvertebrate ICI score in 1982 of only 6.9. Treatment plant upgrades, including the addition of a pretreatment program to remove metals, resulted in substantially improved water quality, as indicated by an average ICI score of 42 in 1990 for the same stretch of river. Similar improvements to the fish community were observed, as indicated by changes in the IBI and MIwb.
The Ohio EPA has also been able to use bioassessment data to track statewide improvements in water quality. An analysis was conducted of changes at sites with at least two years of data (between 1974 and 1995), encompassing hundreds of sites spread over the entire state, representing a good cross-section of the major streams and rivers, and demonstrating both point source and non-point source impacts. Sample sizes were 1160 sites, 845 sites, and 528 sites for the IBI, MIwb, and ICI, respectively. A comparison of the two time periods (earliest and latest) indicated that, for each index, a statistically significant positive change over time occurred at most sites, although none of the waterbodies has completely attained the applicable biological criteria. The most generally observed pattern has been for the macroinvertebrate community (as measured by the ICI) to improve first, followed by fish abundance and biomass (MIwb); structural and functional indicators (IBI) typically respond last. The size of the changes in these indices increases exponentially with the time period between sampling. Fortunately, Ohio has been using multiple assemblages since the early stages of implementing biocriteria, or seeing such patterns would not have been possible. Because the pattern of improvements in biological measures is fairly consistent, it provides a means to track progress and link it to improvements in wastewater treatment.
Lesson Learned
Bioassessment data have provided evidence that the money spent on POTW upgrades and industrial pretreatment is worthwhile and results in demonstrable improvements in water quality.
Additional Information
Chris Yoder (chris.yoder@epa.state.oh.us) at 614-728-3382
Ohio EPA website Exit
References
Rankin, E.T., C.O. Yoder, and D. Mishne, 1997. Ohio Water Resource Inventory, Volume I: Summary, Status and Trends, 1996. Ohio EPA Technical Bulletin.
Yoder, C.O., and E.T. Rankin, 1995. The role of biological criteria in water quality monitoring, assessment and regulation. Ohio EPA Technical Report MAS/1995-1-3.
