"Response Signatures" Indicate Pollution Sources in Ohio
Ohio's water quality standards include a tiered classification of aquatic life uses and numeric biocriteria corresponding to these uses. The criteria are based on stream fish assemblages (Index of Biotic Integrity, IBI, and the Modified Index of Well-Being, MIwb) and stream macroinvertebrate assemblages (Invertebrate Community Index, ICI). Criteria for each biological index are specified for each of Ohio's five ecoregions and are used in conjunction with chemical and whole effluent toxicity evaluation methods and criteria to monitor and assess the condition of the state's surface waters. Ohio EPA has found that twice as many impaired waters have been identified using biocriteria and water chemistry together than were found using chemistry alone, a finding that has documented the value of an integrated approach.
The data necessary to use biocriteria are obtained from biological surveys. Ohio EPA conducts biosurveys to determine if the use designations are appropriate, to what degree the uses are being attained, and to ascertain changes over time, especially before and after implementation of point source controls or best management practices.
Biological Response Signatures
Bioassessment data can be used to discriminate among different stressors. The Ohio EPA has been able to discern consistent patterns in the biological metrics and indices that correlate with known types of impacts. These unique patterns are known as "biological response signatures." To identify distinct signatures, Ohio first classified well-characterized sites according to the major type of impact present, using known sources and chemical, physical, and toxicological information. Each of more than 1200 sites was assigned a primary impact type (see box at right). The clustering of biological metrics for each type of site formed patterns that, in many cases, were distinct and did not overlap with the patterns seen at other site types. This was especially true for the Complex Toxic impact (combination of major municipal and industrial point sources), which was clearly distinct from the other impact types, notably the Flow Alteration and Agricultural Nonpoint Source types. For example, characteristics of fish communities typifying the Complex Toxic impact included a certain range for three particular metrics (IBI, MIwb, and DELT anomalies). The DELT (incidence of deformities, eroded fins, lesions, and tumors) parameter was particularly diagnostic. When these responses occurred in combination, a diagnosis of Complex Toxic impact could be made. An exception that was observed, which highlights the ability of biological data to provide more accurate information than chemical, physical, or process characteristics, was a sample in the Agricultural Nonpoint Source type which possessed all three of the fish community characteristics associated with the Complex Toxic impact. Further investigation indicated that this site was downstream from an experimental agricultural demonstration plot with atypical pesticide use.
Impact Types
- Complex Toxic
- Conventional Municipal/Industrial
- Channelization
- Agricultural Nonpoint
- Flow Alteration
- Impoundment
- Combined Sewer Overflows/ Urban
- CSOs/Urban with Toxic
- Livestock Access
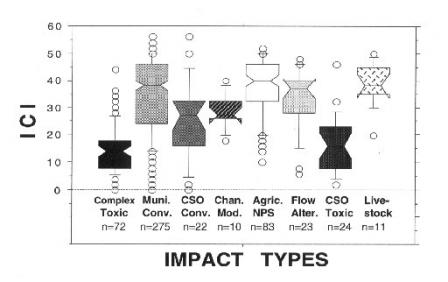
Similar to the fish responses, a pattern of macroinvertebrate community responses emerged that was diagnostic, especially in separating the Complex Toxic impact from the other types of impact. One particular parameter (percent Cricotopus, a species of midges) differentiated the Complex Toxic impact type better than any other ICI metric or aggregation.
At the onset of data collection, there was no way of knowing which parameters would prove to be diagnostic. Taxonomic detail and the inclusion of multiple organism groups in monitoring produced the data necessary for developing more powerful and sensitive analytical tools such as biological response signatures. Once response signatures are developed, they can be used to help predict or diagnose the most probable sources of impact at another site under study. This approach has proved particularly useful in assigning causes and sources of impact for 305(b) reports and in supporting enforcement and litigation. It has been used to link effects with specific discharges, especially those involving the Complex Toxic impact type, and to pinpoint the discharge rather than poor habitat or other factors as the likely cause of impairment.
The Response of the Benthic Macroinvertebrate Assemblage (ICI) to Various Types of Impacts (provided by Ohio EPA)
Lesson Learned
Evaluation of bioassessment data revealed patterns that can be used to delineate predominant causes and sources of aquatic life use impairment. These biological response signatures provide additional evidence to correlate measured degradation with likely sources or discharges.
Additional Information
Chris Yoder (chris.yoder@epa.state.oh.us) at 614-728-3382 or visit the Ohio EPA website Exit
References
Yoder, C.O., 1991. The integrated biosurvey as a tool for evaluation of aquatic life use attainment and impairment in Ohio surface waters. In Biological Criteria: Research and Regulation, Proceedings of a Symposium, 12-13 December 1990, Arlington, VA, U.S. EPA, Office of Water, Washington, DC, EPA-440/5-91-005:110.
Yoder, C.O., and E.T. Rankin, 1995. Biological response signatures and the area of degradation value: new tools for interpreting multimetric data. pp. 263-286. In W.S. Davis and T.S. Simon, eds. Biological Assessment and Criteria: Tools for Water Resource Planning and Decision Making, Lewis Publishers, Boca Raton, FL.