Three Decades of Increasingly Useful Information in Ohio
Program History and Overview
Ohio has been conducting biological monitoring of state surface waters since the late 1970s. In 1978, the state's water quality standards were revised to include a tiered classification of aquatic life uses (as depicted in the figure below). These classifications formed the basis for the early narrative biological criteria established in 1980. In the mid-1980s, the state began developing standardized sampling, analysis, and interpretive approaches to support a more quantitative/ numerical framework. Based on this work, Ohio adopted numeric biocriteria into its Water Quality Standards in 1990.
The criteria are numeric values based on fish and macroinvertebrate assemblages in streams. A multi-parameter physical habitat assessment approach is used to evaluate impairment in the physical habitat. The establishment of regional reference conditions enabled a criteria for each biological index to be developed for each of Ohio's five ecoregions. These criteria are further organized by organism group, index, site type, and aquatic life use designation. Biocriteria are used in conjunction with chemical and whole effluent toxicity evaluation methods and criteria to monitor and assess the condition of the state's surface waters.
The basic data necessary to use biocriteria are obtained from biological surveys. Ohio EPA conducts biosurveys to determine if the use designations are appropriate, to what degree the uses are being attained, and to ascertain changes over time, especially before and after implementation of point source controls or best management practices. Currently, bioassessment data are used in Ohio for a variety of resource management activities.
The Ottawa River Story
 Even the early narrative biocriteria played a major role in assigning and evaluating use designations, water quality management plans, and justifying advanced wastewater treatment. An example of the use of bioassessment data well before the development of the numeric biocriteria in Ohio involves NPDES permittees discharging to the Ottawa River.
The Ottawa River, in northwestern Ohio, has historically been heavily impacted, primarily by industrial and municipal wastewater sources in the vicinity of the city of Lima. During the 1960s, more than 37 river miles were devoid of fish. Improved wastewater treatment and stricter enforcement during the 1970s coincided with reductions in loadings of pollutants such as nitrogen, phosphorus, and oxygen-consuming pollutants. Between 1974 and 1977 (before the adoption of biocriteria), biosurveys were conducted, including sampling of benthic macroinvertebrate and fish communities. Although this investigation preceded the development of standardized sampling techniques and metrics, it clearly showed that conditions had improved relative to those of the 1960s.
Despite overall improvements, however, severely degraded conditions continued below Lima, where several significant point source discharges are located. These sources include the Lima WWTP, combined sewer overflows (CSO), an oil refinery, and a petrochemical plant. During the period from 1974-1977, results of chemical sampling supported the bioassessment data in showing very poor conditions. Causes of impairment were attributed to ammonia and (to a lesser degree) low dissolved oxygen and elevated chromium levels. Not until the mid-1980s did biosurveys show dramatic biological recovery from conditions observed during the 1970s, largely stemming from reduced loadings of toxic and oxygen-consuming pollutants following implementation of the 1972 Clean Water Act and its amendments. Subsequent bioassessment data showed that slight to moderate improvements continued through 1989. These trends, as indicated by the Qualitative Community Tolerance Value (QCTV), are depicted in the figure below. The QCTV is a score based on the median pollution tolerance values of all organisms from sample collected at a site. Lower QCTV scores indicate the presence of organisms that can tolerate degraded conditions.
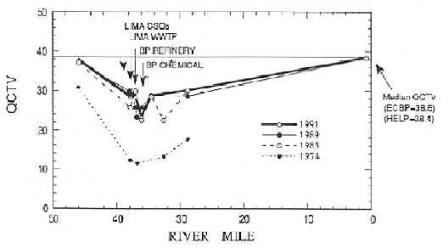 Longitudinal trend of the median (50th percentile) Qualitative Community Tolerance Value (QCTV) in the Ottawa River during July-September, 1991, 1989, 1985, and 1974. The horizontal line represents the median QCTV for the Eastern Corn Belt Plain (ECBP) and Huron Erie Lake Plain (HELP) ecoregional reference site databases.
Biosurveys conducted during the 1980s indicated that sites upstream and far downstream of Lima had recovered enough to prove that agricultural areas, provided they retain their natural physical habitat, can achieve and exceed criteria for warm water habitat (WWH). Based on this evidence, Ohio has redesignated the use classification for the Ottawa River from limited resource water to WWH. This same evidence has also helped to isolate permit violations and runoff from urban-industrial sources as the likely causes of continuing impairment in segments near Lima that have not improved to the same degree. Data from the 1991 biosurvey prompted the use of water quality-based effluent limitations, including limits on chronic toxicity, in the re-issued permits for Lima area dischargers. The investigation pointed to a pattern of cumulative noncompliance with permit limits among the three major dischargers. Individually, these violations did not appear significant, but in aggregate, and coupled with stress from CSO and stormwater discharges, the effect was ongoing non-attainment of water quality criteria. Spills and landfill leachate were also discovered during the 1991 biosurvey. The permittees, the state, local agencies, and citizens formed an interest group to determine the feasibility of and possible ways to restore WWH use attainment. Even though they do not completely agree on all the issues, the local agencies and citizens maintain a high level of interest, largely due to the existence of definitive data on the river.
The Ottawa River remains one of Ohio's most impacted streams. Improvements in some segments, however, have provided evidence to justify higher restoration goals and an upgraded use designation. Definitive data collected through biosurveys have made it possible for Ohio to establish trends, document improvements, and develop credible biocriteria for their water quality standards. Without the robust database generated within the concept of a regional reference site approach, the effort to upgrade the use designation to WWH in the mid-1980s might not have succeeded. This would have dampened public interest and hindered meaningful restoration efforts.
Lesson Learned
Ohio's biosurvey results from the 1970s through the present have documented water quality improvements in the Ottawa River, have identified areas of on-going impairment, and have been instrumental in upgrading the use designation, leading to further improvement.
Additional Information
Chris Yoder (chris.yoder@epa.state.oh.us) at 614-728-3382
You can also visit the Ohio EPA website.Exit
References
Martin, G.L., T.J. Balduf, D.O. McIntyre, and J.P. Abrams, 1979. Water quality study of the Ottawa River, Allen and Putnam Counties, Ohio. Ohio Environmental Protection Agency, Office of Wastewater Pollution Control, Division of Surveillance and Water Quality Standards, OEPA 79/1.
Yoder, C.O., and E.T. Rankin, 1995. Biological criteria program development and implementation in Ohio, pp. 109-144 (Chapter 9). In W.S. Davis and T. Simon (eds.). Biological Assessment and Criteria: Tools for Water Resource Planning and Decision Making. Lewis Publishers, Boca Raton, FL.
Ohio EPA, 1992. Biological and Water Quality Study of the Ottawa River, Hog Creek, Little Hog Creek, and Pike Run (Hardin, Allen, and Putnam Counties, Ohio). OEPA Technical Report EAS/1992-9-7.