Technical Approaches for the Sensor Data on the AirNow Fire and Smoke Map
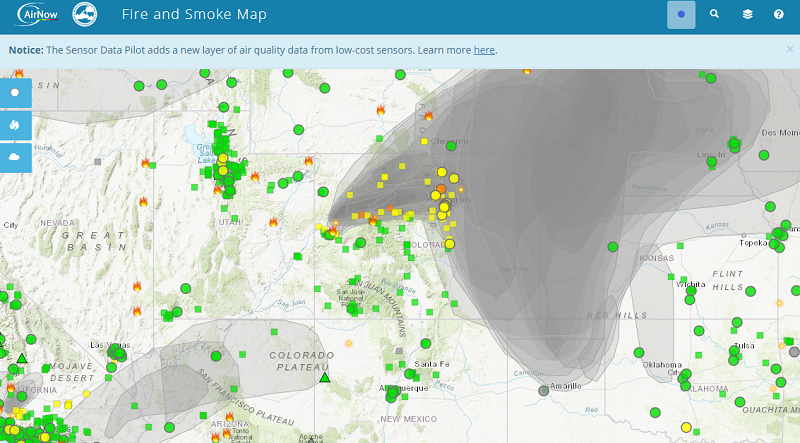 Fire and Smoke Map on AirNow.gov.EPA and the U.S. Forest Service (USFS) are conducting the AirNow Sensor Data Pilot to show data from air sensors on the Fire and Smoke Map, located on the AirNow.gov website.
The goal of the pilot, launched in August 2020, is to provide people with additional information on air quality during wildfires, especially in areas where AirNow monitors may not exist. The Fire and Smoke Map includes data from:
- Sensors from PurpleAir, a company that crowdsources data. The data is available to the public.
- Stationary long-term monitoring stations that are used to report outdoor air quality to the public on AirNow.gov. These are generally operated by state, local or tribal air quality agencies and stay in place for many years.
- Temporary monitors that agencies use to monitor smoke events.
The map also provides information on large fire incidents, satellite-detected fires, smoke plumes, and special smoke statements.
Data from air sensors are often not comparable to data from regulatory-grade monitors. In order to make the data more comparable, sensor data must pass some quality control checks and be mathematically corrected. The sensor data incorporated onto the map during this initial pilot, is fine particulate matter (PM2.5) data from PurpleAir sensors. Fine particulate matter is an air pollutant that can impact the lungs and heart and cause adverse health effects.
EPA developed a series of quality control checks and a U.S.-wide correction equation to make the data more comparable before incorporating it onto the Fire and Smoke Map. This makes it easier for users to compare sensor data and permanent and temporary monitor data side by side.
A video provides a detailed explanation of the scientific process used to develop the U.S.-wide correction equation. Agency scientists discuss the motivation for developing the U.S.-wide correction, describe the data used in the analysis, detail the process to develop the correction equation, and illustrate the steps taken to verify that it is suitable for use on the Fire and Smoke Map.
The video also explores some common concerns about the use of a single U.S.-wide correction equation and the crowdsourced sensor data. This work aims to give air quality managers and technical audiences information about EPA’s research so that they can have confidence in the use of the correction equation for normal ambient conditions and smoke impacted times.
EPA and the USFS plan to continually improve the sensor data map layer. The map will undergo several phases of improvements over time, with the goal of having an upgraded version available in time for the 2021 fire season.
EPA does not endorse any particular commercial product. Mention of trade names or commercial products does not constitute EPA or USFS endorsement or recommendation for use.
AirNow Sensor Data Pilot Video -- This video provides technical information about the underlying data and scientific approach used to develop EPA’s U.S.-wide correction equation for PM2.5 data from PurpleAir sensors and to incorporate this data as a new layer on the AirNow Fire and Smoke map
Related Resources
- AirNow
- Fire and Smoke Map (FAQ on the map and sensor data are available by clicking on the “question” icon on the top right of the map)
- Using AirNow During Wildfires
- Science Matters Newsletter article on research to improve accuracies of air sensors
- Particulate matter basics
Contacts
- For inquiries regarding the sensor data pilot: sensordatapilot@epa.gov
- For inquiries about observations on the map: airnowquestions@epa.gov