Progress
Clean Air Markets Programs have delivered substantial emission reductions and air quality improvements since the first nationwide program, the Acid Rain Program (ARP), which began in 1995. With the addition of the NOX Budget Trading Program (NBP) (2003-2008), the Clean Air Interstate Rule (CAIR) (2009-2014), the Cross-State Air Pollution Rule (CSAPR) (2015-present), CSAPR Update, and Revised CSAPR Update, emissions of key pollutants have continued to fall precipitously. The reduction in ozone and fine particulates (PM2.5) formation resulting from CAIR and CSAPR has provided health benefits as well as improved visibility in national parks and improvements in fresh water ecosystems in the eastern United States.
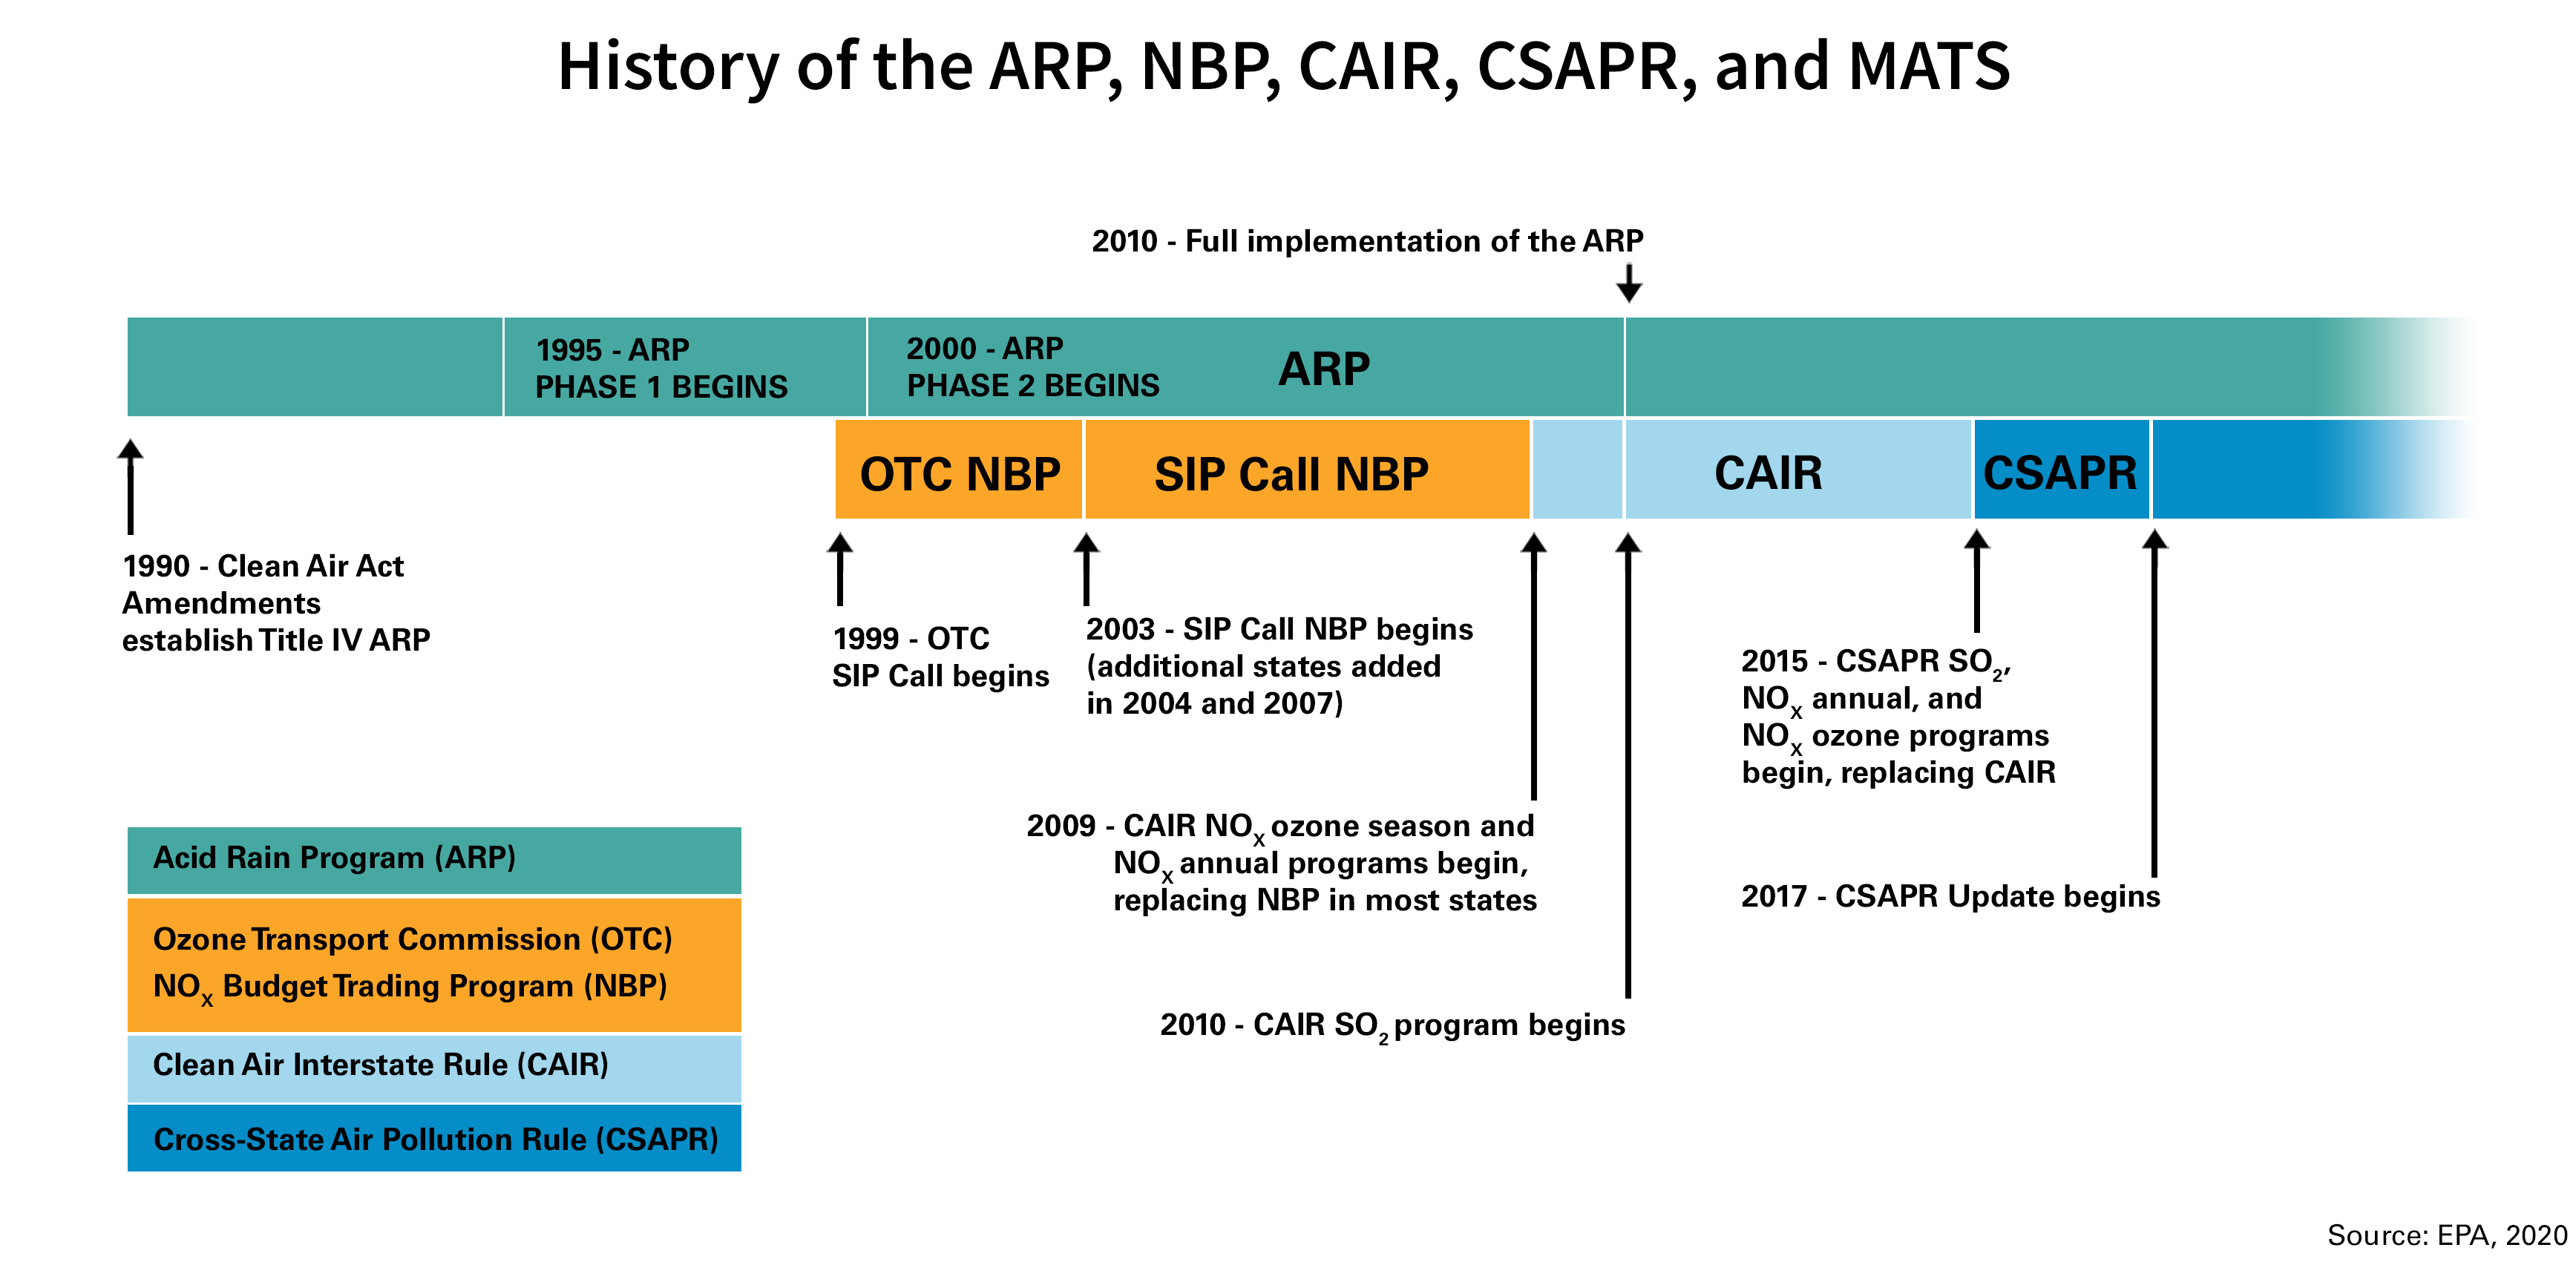
The below graphs depict the history of the Clean Air Markets programs and their impact on emissions reductions over the last 30 years. The first chart, “History of the ARP, NBP, CAIR, CSAPR, and MATS” (click to expand), depicts a timeline of Clean Air Markets Division emissions reduction programs since the Clean Air Act Amendments established the Acid Rain Program. The second chart tracks the decrease in emissions from electric generating units (EGUs) under these programs.
Emissions from coal-fired power plants have decreased significantly since 1990. Regulatory programs, market factors, and industry shifts have contributed to these emission reductions.
year,Sulfur Dioxide,Nitrogen Oxides,Ozone Season Nitrogen Oxides
1990,15.73,6.42
1995,11.83,5.84
1996,12.51,6.01
1997,12.94,6.03,2.57
1998,13.09,5.97,2.72
1999,12.45,5.50,2.45
2000,11.20,5.10,2.20
2001,10.64,4.71,2.03
2002,10.19,4.47,1.89
2003,10.59,4.17,1.6
2004,10.26,3.76,1.2
2005,10.22,3.63,1.27
2006,9.39,3.41,1.18
2007,8.93,3.28,1.15
2008,7.62,3.00,1.07
2009,5.82,2.02,0.84
2010,5.17,2.11,0.93
2011,4.55,1.98,0.89
2012,3.32,1.72,0.79
2013,3.25,1.73,0.75
2014,3.16,1.67,0.70
2015,2.22,1.38,0.62
2016,1.49,1.20,0.55
2017,1.34,1.07,0.47
2018,1.26,1.03,0.45
2019,0.97,0.88,0.39
- Progress Reports evaluate the progress of the Clean Air Markets Programs and show the combined effects of these programs on power sector emissions of SO2, NOx, ozone and fine particles (PM2.5). Also provided in these reports are the resulting benefits of these programs including emission reductions, compliance results, and a variety of human health and environmental indicators.
- Power Plant Emission Trends provide visual displays of data collected as part of the Acid Rain Program and the Clean Air Interstate Rule, making it easy to understand where and when emissions changes have occurred.
- Facility Level Comparisons updates of quarterly sulfur dioxide (SO2), nitrogen oxides (NOx), carbon dioxide (CO2), and mercury (Hg) emissions data from power plants subject to the Acid Rain Program (ARP), the Cross-State Air Pollution Rule (CSAPR), CSAPR Update, Revised CSAPR Update, and the Mercury and Air Toxics Standards (MATS) to make it easy for the public to track changes in emissions from these sources.
- Acid Rain Program Results highlight the success of the Acid Rain Program both in emissions reductions and reduction in wet sulfate deposition (SO42-, commonly referred to as "acid rain").
Additional Resources
- Please see our Data Resouces page to quickly and easily access tools and resources available from the Clean Air Markets Programs.