ACE: Biomonitoring - Bisphenol A (BPA)
Indicators
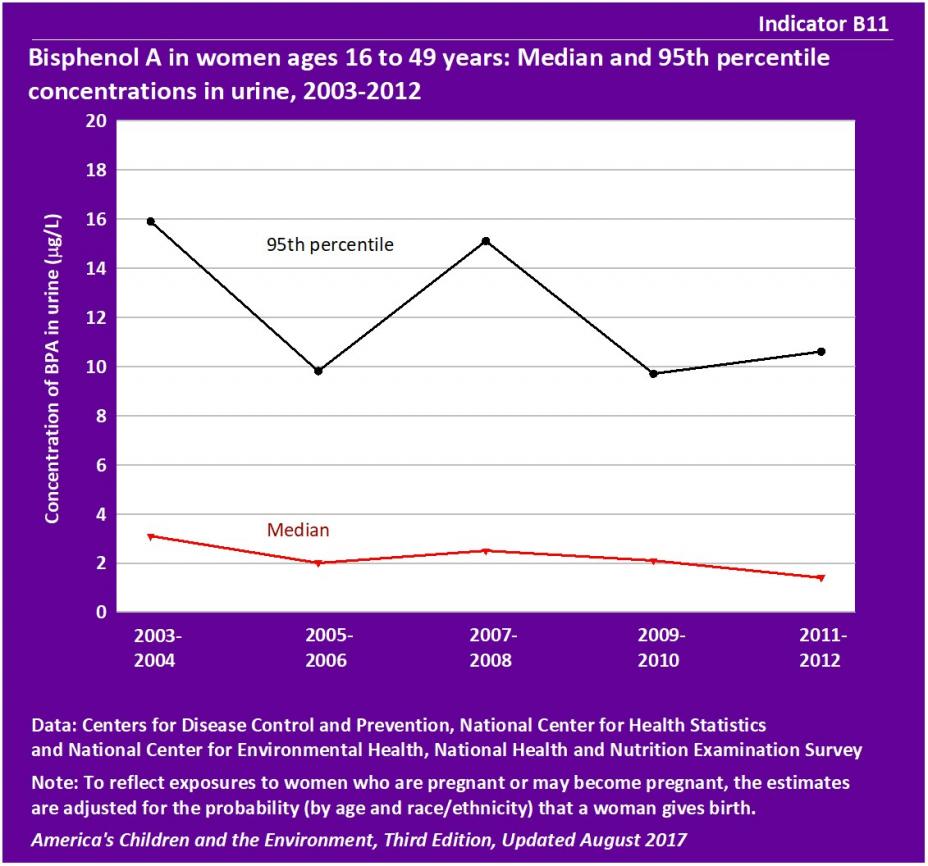
Indicator B11
![]()

Data characterization
- Data for this indicator are obtained from an ongoing continuous survey conducted by the National Center for Health Statistics.
- Survey data are representative of the U.S. civilian noninstitutionalized population.
- BPA is measured in urine samples obtained from individual survey participants.
- From 2003-2004 to 2011-2012, the median concentration of BPA in urine among women ages 16 to 49 years generally decreased from 3 µg/L to 1 µg/L. The decreasing trend was statistically significant.
- From 2003-2004 to 2011-2012, the concentrations of BPA in urine at the 95th percentile varied between 10 µg/L and 16 µg/L, and was 11 µg/L in 2011-2012. There was no statistically significant trend in 95th percentile concentrations of BPA over the years shown.
- Between 2003-2004 and 2011-2012, the concentrations of BPA in the 95th percentile ranged from 5 to 8 times the median levels for women ages 16 to 49 years.
- In 2009-2012, the median concentration of BPA in urine of Black non-Hispanic women was about 4 µg/L, which was higher than the median concentrations in White non-Hispanic women, Mexican-American women, and women of “All Other Races/Ethnicities.” The differences between Black non-Hispanic women and women in other race/ethnicity groups were statistically significant. (See Table B11a.)
- Women living below the poverty level had higher median concentrations of BPA in urine than those living at or above poverty level, a difference that was not statistically significant. (See Table B11a.)
- Among White non-Hispanic women, those with family incomes below poverty level had higher median concentrations of BPA in urine than those at or above poverty level. The differences between the income groups were not statistically significant.(See Table B11a.)
- Higher concentrations of BPA were observed in the urine of women below poverty level at the 95th percentile (13 µg/L) compared with women at or above poverty level (9 µg/L). This difference was not statistically significant.(See Table B11b.)
- In 2009-2012, the 95th percentile concentration of BPA in urine of Black non-Hispanic women was about 15 µg/L, which was higher than the median concentrations in White non-Hispanic women and Mexican-American women. The differences between Black non-Hispanic women and White non-Hispanic women or Mexican-American women were statistically significant after adjustment for differences in age and income.(See Table B11b.)
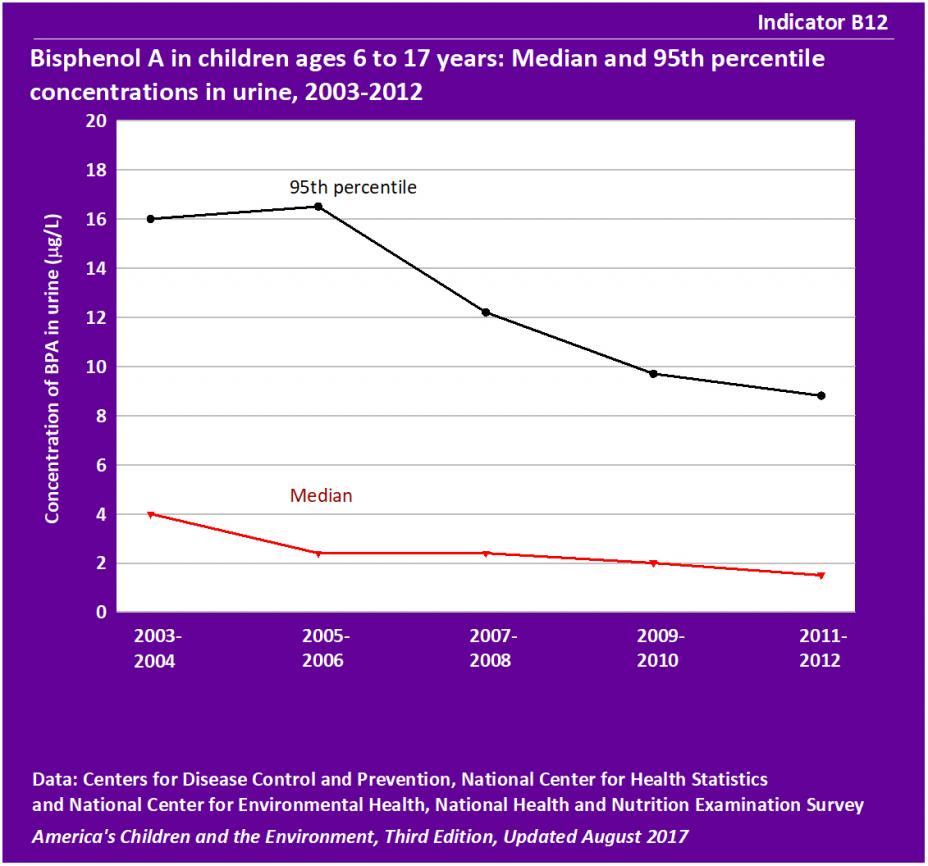
Indicator E6
![]()

Data characterization
- Data for this indicator are obtained from an ongoing continuous survey conducted by the National Center for Health Statistics.
- Survey data are representative of the U.S. civilian noninstitutionalized population.
- BPA is measured in urine samples obtained from individual survey participants.
- Among children ages 6 to 17 years, the median concentration of BPA in urine of children ages 6 to 17 years decreased from 4 µg/L in 2003-2004 to 2 µg/L in 2011-2012. The concentration of BPA in urine at the 95th percentile decreased from 16 µg/L in 2003-2004 to 9 µg/L in 2011-2012. These decreasing trends were statistically significant.
- Between 2003-2004 and 2011-2012, the concentrations of BPA in the 95th percentile ranged from 4 to 7 times the median levels for children ages 6 to 17 years.
- In 2009-2012, median concentrations of BPA in urine of Black non-Hispanic children ages 6 to 17 years were higher than in White non-Hispanic children, Mexican-American children, and children of “All Other Races/Ethnicities.” These differences were statistically significant. (See Table B12a.)
- BPA concentrations at the 95th percentile were similar for Black non-Hispanic, White-non Hispanic, and Mexican-American children ages 6 to 17 years in 2009-2012. (See Table B12b.)
- In 2009-2012, BPA concentrations were similar for age groups 6 to 10 years, 11 to 15 years, and 16 to 17 years, both at the median and at the 95th percentile. (See Table B12c.)
Background Text
About the BPA Indicators
Indicators B11 and B12 present information about BPA levels measured in children and women. The data are from a national survey that collects urine specimens from a representative sample of the population every two years, and then measures the concentration of various contaminants in urine. These indicators focus on both women of child-bearing age and children because of concern for potential adverse effects in children born to women who have been exposed to BPA and in children exposed to BPA.
- Indicator B11 presents concentrations of BPA in urine of women ages 16 to 49 years from 2003-2012.
- Indicator B12 presents concentrations of BPA in urine of children ages 6 to 17 years from 2003-2012.
BPA is a chemical found in many plastics used to make and line food and drink containers. Exposure to BPA is believed to primarily occur through diet, when BPA migrates from food and drink containers. BPA is present in human urine samples from all age groups including infants, toddlers, children and adults. Children have the highest estimated daily intake of BPA and the highest measured levels of urinary BPA compared to adults of all age groups.
There have been published studies suggesting that BPA may be an endocrine disrupting chemical. Endocrine disruptors act by interfering with naturally occurring hormones. The effects of low-dose exposure to BPA in lab animals are debated within the scientific community: some researchers have found no developmental effects, while others have found behavioral and neural effects, abnormal urinary tract development, development of lesions in the prostate gland, and early onset of puberty in females. Based on a review of existing scientific literature, the National Toxicology Program (NTP) determined that there was “some concern” (the midpoint on a five-level scale ranging from “negligible” to “serious”) for effects of BPA on the brain, behavior, and prostate gland in fetuses, infants, and children; “minimal concern” for effects on the mammary gland and onset of puberty in females; and “negligible concern” for fetal or neonatal mortality, birth defects, and reduced birth weight and growth.
Indicators B11 and B12 present BPA levels measured in urine of women and children from the National Health and Nutrition Examination Survey (NHANES).
More information about BPA and Indicators B11 and B12 is provided in the updated BPA section of America's Children and the Environment, Third Edition.
Related Links
National Institutes of Health (NIH): Bisphenol A (BPA)
U.S. EPA: Bisphenol A (BPA) Action Plan Summary
U.S. Food and Drug Administration (FDA): Bisphenol A (BPA): Use in Food Contact Application
U.S. Food and Drug Administration (FDA): FDA Continues to Study BPA
Methods
Summary of Methods - BPA
The National Center for Health Statistics, a division of the Centers for Disease Control and Prevention, conducts the National Health and Nutrition Examination Surveys (NHANES), a series of U.S. national surveys of the health and nutrition status of the noninstitutionalized civilian population. Interviews and physical examinations are conducted with approximately 10,000 people in each two-year survey cycle. The survey measures BPA and its metabolite levels in urine samples collected from NHANES participants.
Indicator B11 uses the NHANES data to present median and 95th percentile concentrations of BPA measured in urine of women ages 16 to 49. Indicator B12 uses the NHANES data to present median and 95th percentile concentrations of BPA measured in urine of children ages 6 to 17 years.
Detailed Methods for Indicators B11 and B12
Metadata for National Health and Nutrition Examination Survey (NHANES)
