Long Creek Conceptual Model Diagram
This diagram was developed for Long Creek, a coastal plain stream in Maine. Hexagons represent sources; rectangles represent proximate stressors; ovals represent biological effects; and round-edged rectangles represent additional steps in the causal pathway.
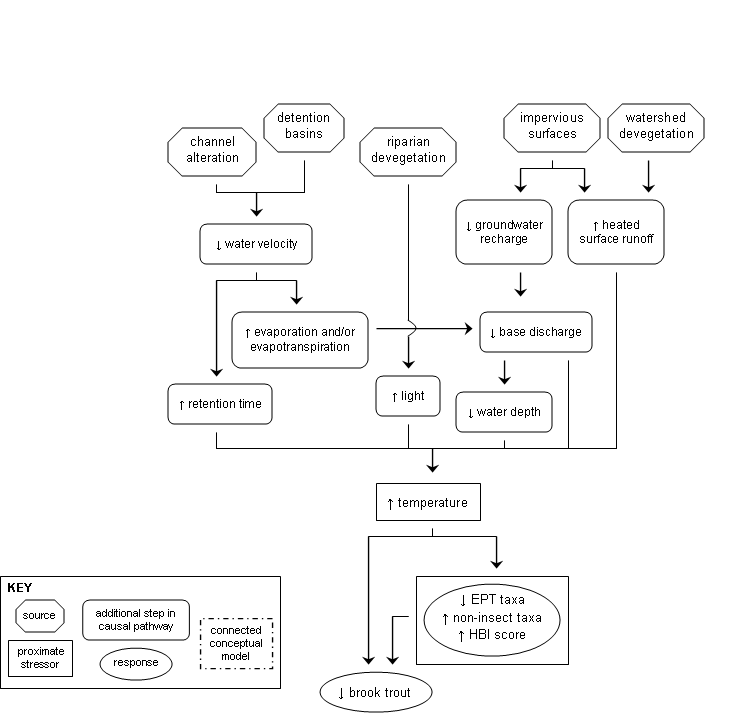 Figure 2-2. A simple conceptual model diagram illustrating an increased water temperature as a candidate cause of biological impairment.
*Note that invertebrate effects also are proximate stressors for brook trout, due to reductions in fish prey.