Step 2. List Candidate Causes
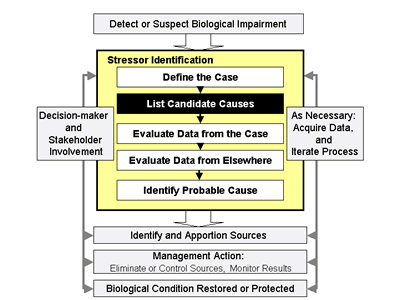 Figure 2-1. Illustration of where Step 2. List Candidate Causes fits into the Stressor Identification process.After the case has been defined (Step 1), you begin to consider the candidate causes, or stressors, which may be responsible for observed biological effects (Figure 2-1). Listing candidate causes refines the scope of causal analysis, and provides a framework for assembling available data and determining data needs for the causal analysis.
The initial list of candidate causes should include all stressors that could be causing the biological impairment. These stressors may be chemical (e.g., elevated concentrations of metals/ammonia), physical (e.g., increased sediment/water temperature) and/or biological (e.g., increased abundance of an invasive species) factors. A candidate cause simply can be a proximate stressor, or the agent that organisms contact or with which they co-occur (e.g., low dissolved oxygen concentrations).
A candidate cause may include more details about how that proximate stressor produces a response (e.g., low dissolved oxygen levels asphyxiating fish). A candidate cause can also include details of the precursors of the proximate stressor. For example, increased nutrients can increase algal biomass, decreasing dissolved oxygen levels once the algae die and decompose). More detail is better if it helps identify ways of distinguishing among candidate causes.
Listing candidate causes refines the scope of causal analysis, and provides a framework for assembling available data and determining data needs for the causal analysis.
The candidate cause list can be based on factors including existing site-specific data (including possible sources), knowledge of processes/mechanisms or stakeholder input. Because biological effects usually involve processes at multiple spatial/temporal scales, listing candidate causes should involve consideration of the scales at which each cause operates. The map delineating the case’s geographic scope may be refined here, by adding pollution sources or environmental conditions affecting which candidate causes are listed.
After the initial list of candidate causes is completed, conceptual model diagrams can be developed for each candidate cause. These models are simple graphics showing the linkages between potential sources, stressors or candidate causes, and biological effects in the case. These model diagrams can help you think about potential mechanisms causing the observed effects, which can help refine the list of candidate causes.
Because these diagrams can show where different candidate causes may interact, they may be especially useful when multiple stressors contribute to the impairment. The models also provide a framework for keeping track of what data are available and relevant to each candidate cause. Additionally, they serve as an effective way to communicate to stakeholders the working hypotheses and assumptions about how and why effects are occurring.
Once the list of candidate causes has been completed and conceptual models have been drawn, you can begin analysis of the candidate causes.
To do this, proceed to Step 3: Evaluate Data from the Case.
You being this step by starting with an initial list, and then refining it by making a map; drawing on available information on sources, stressors, and exposures; constructing a conceptual model diagram; and engaging stakeholders. Then continue to assemble relevant references throughout the process.
Make an Initial List
To begin the process of identifying and listing candidate causes, it helps to make a relatively long list of all stressors thought to occur in a waterbody. Include stressors that stakeholders have good reason to believe may be important. Consult other ecologists for potential causes of the impairment.
It may be helpful to review available lists, such as:
- Stressors that can potentially cause biological impairment
- Stressor lists from monitoring studies
- Standard lists developed by the state or other entity (e.g., Mississippi)
Standard lists can provide a useful and consistent starting point, but you should keep in mind that no list is complete. Some causes are unusual and therefore not included on standard lists. In addition, the listed causes are likely to be generic (e.g., metals or invasive non-native species) whereas candidate causes should be specific (e.g., zinc or zebra mussels). The initial list is refined by moving through the process of drawing a map, gathering information, constructing a conceptual model diagram, and engaging stakeholders.
The Sources, Stressors, and Responses Volume (volume 2) of CADDIS provides some suggestions on what to look for when deciding whether to include a cause on your list.
Multiple stressors may act together to cause effects or may reflect different steps in the same causal pathway. Consider whether you should include specific combinations on your list or can combine some to simplify analysis in later steps.
Gather and Map Information on Potential Sources
Information about point and nonpoint sources near the waterbody can suggest potential candidate causes. Point sources, such as drainage pipes, outfalls, and ditches, are easily identified as sources. Constituents of the effluent or the effluent as a whole can be listed as candidate causes. Other sources may be located some distance from the resource; for example, motor vehicles and smoke stacks generate candidate causes such as acid rain or nitrogen enrichment. Particular land uses often generate a consistent suite of stressors. For example, siltation, nutrients and pesticides are commonly associated with agriculture.
Locations of sources and stressors should be mapped. Maps or other geographical representations that show the location and severity of impairments are essential for orienting participants, examining spatial relationships, and eliciting information from stakeholders. Maps can range from simple hand-drawn ones to computer-generated versions. Useful geographic information includes the location of the impairment and known point and nonpoint sources, cities, roads, dams, tributaries, and land uses.
You may want to examine your readily available data using exploratory data analysis. Remember you are only exploring the data to see if it suggests any candidate causes. You are not yet undertaking the full fledged analysis that you will do in Steps 3 and 4.
Construct a Conceptual Model Diagram
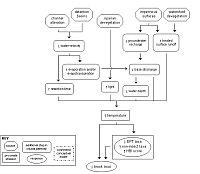 Figure 2-2. A simple conceptual model diagram for increased water temperature as a candidate cause of biological impairment. Click image to view a larger version of the figure.Conceptual model diagrams link the candidate causes with potential sources and effects. This part of the process documents a likely explanation of how the candidate cause could have produced the impairment. Using a pictorial conceptual model is useful to introduce the ecological relationships. Then a box and arrow diagram can be used to show details of the relationships among sources, stressors, receptors, and intermediate processes. The diagram should show the pathways and causes considered in the study. Separate diagrams for each stressor or pathway can keep the focus on the analysis steps that will follow. Figure 2-2 shows a box-and-arrow conceptual model that was developed for a case study in coastal Maine; another example is the conceptual model diagram developed for the Little Scioto River case study you also can view a diagram developed for the Little Scioto River in Ohio. For additional examples and advice on conceptual model development, consult Jorgensen (1994), Suter (1999), Cormier et al. (2000c), U.S. EPA (1998a) (especially Appendix C), and the Interactive Conceptual Diagrams volume (volume 5) of CADDIS.
- Learn more about conceptual model diagrams
- Example conceptual model diagram
- Interactive Conceptual Diagrams (ICDs) Module
Engage Stakeholders
Involving a broad range of stakeholders such as managers, local citizens, and scientists from other disciplines can be crucial for the success of a causal investigation. Involving the managers and other decision-makers ensures that the investigation will be relevant to decisions and actions. Involving scientists from multiple disciplines ensures that important causal pathways are considered. Involving local citizens helps to ensure that the investigation is inclusive of local knowledge and concerns.
Fruitfully engaging stakeholders in not a trivial task. Advice on engaging stakeholders can be found in Watershed Academy's Getting In Step Guide, and a fairly comprehensive list of Public Involvement Techniques can be found on the U.S. EPA sponsored website, Sustainable Management Approaches and Revitalization Tools - electronic (SMARTe).
The draft map and conceptual model diagram can provide a useful focus for stakeholders to engage in the discussion easier. Questions asked of stakeholders may include the following:
- What have we missed?
- Is there additional information that should be considered in the investigation?
- Are there potential causes that should be added to the list for us to analyze?
Finalize the List
After a list of candidate causes is developed, it should be winnowed to the list of candidate causes that will be evaluated further.
Listing candidate causes requires balancing two issues. If you include every stressor, the causal analysis will be burdensome—but being too selective in this step may eliminate the true cause.
There are two logical strategies that you can use to finalize the list of candidate causes:
- Use the initial list as a check list by selecting candidate causes from it, or
- Use the initial list as a scratch list by eliminating or deferring listed potential causes from further consideration.
We recommend that you document the rationale for omitting potential candidate causes from further consideration. The list of omitted causes may best be thought of as a list of deferred or second tier candidate causes. That is, they may be revisited if a probable cause is not identified and an iteration of the process is needed.
Generalizations about when to exclude or defer a cause from further consideration is difficult, but it is usually based on historical knowledge of the water body and its watershed, or knowledge of biology and mechanism. Four general rationales are used, listed below in rough order of decreasing level of confidence for either excluding or deferring analysis of a potential cause.
Evidence that the cause is absent based on high quality stressor measurements:
In most cases, this evaluation is equivalent to analysis and evaluation of spatial and temporal co-occurrence. That is, although the cause could occur, data indicate that it has not occurred at the site. For example, if continuous data loggers indicate that DO concentrations at the impaired location are not lower than those at a reference location during the preceding year, low DO may not be listed as a candidate cause. The degree of quality needed to defend omission from the analysis will vary with the stressor and the level of confidence desired. In general, long-term (e.g., a year or more), temporally continuous and spatially extensive data are needed for a high level of confidence in omitting a potential cause.
Since the data are available and must be analyzed in order to omit the potential cause, we suggest that you include these less likely candidate causes in the strength-of-evidence analysis (Step 3). By including rather than omitting these candidate causes, they can be compared relative to other candidate causes, making the assessment more complete and transparent and decreasing the likelihood of overlooking a cause.
Evidence of an impossible cause or mechanism:
Indisputable evidence that a cause would not occur at the site (e.g. low dissolved oxygen in a cataract or very turbulent stream) or that the biological effect is never caused by the agent (e.g., over-harvesting causing liver cancer in fish). This type of information is sufficient to omit a potential cause from the list of candidate causes. When available, evidence that demonstrates a candidate cause is impossible is discussed in the Sources, Stressors, and Responses Volume.
No evidence that the cause is present:
A lack of the observations that usually accompany a biological effect due to a particular cause. We provide check lists of factors that suggest that a potential cause be listed (see the Sources, Stressors, and Responses Volume). If these sources, site evidence, or biological effects are absent, then the cause is either unlikely or you are lacking information. For example, if the watershed of an impaired stream is undisturbed forest, if sediment accumulation is not observed at the impaired site, and if known sediment-sensitive species are present, then sediment may be omitted from the list of candidate causes. Using “absence of evidence” as a reason to omit a potential cause from the analysis is risky. Use it with great caution, because it could be that the relevant evidence is present but just has not yet been observed. For example, you may have observations from the autumn, but the exposures may occur in the winter.
Insufficient data and evidence:
No data are available or available data are untrustworthy for evaluating the potential cause. In these situations, you may decide to defer analysis until data become available or until analysis is not needed because a probable cause was identified, remediated, and the biological condition improved. By deferring a potential candidate cause rather than excluding it, you demonstrate scientific awareness and lack of bias.
Additional tips for listing candidate causes are provided that may help you during this process.
References
- Cormier SM, Smith M, Norton S, Neiheisel T (2000) Assessing ecological risk in watersheds: a case study of problem formulation in the Big Darby Creek Watershed, Ohio, USA. Environmental Toxicology and Chemistry 19(4 pt 2):1082-1096.
- Jorgensen SE (1994) Fundamentals of Ecological Modelling. Elsevier, Amsterdam, Netherlands.
- Suter GW II (1999) Developing conceptual models for complex ecological risk assessments. Human and Ecological Risk Assessment 5:375-396.
- U.S. EPA (1998) Guidelines for Ecological Risk Assessment. U.S. Environmental Protection Agency, Risk Assessment Forum, Washington DC. EPA/630/R-95/002F.
At the conclusion of Step 2, you should have the following products:
- A list of candidate causes,
- A map showing possible sources and other geographic features, and
- A conceptual model diagram of the candidate causes.
These products are used to focus assembly and analysis of data when you proceed to Steps 3 and 4.