Worksheet Examples
This section presents 14 worksheets documenting each step of a causal analysis conducted specifically for the Little Scioto River, Ohio as an example. The linked steps in the list below correspond to the individual worksheets for this example, so that either clicking on the list by name or number (tabs) will bring you to the same information.
- Define the Case
- List Candidate Causes
- Assemble Data from the Case
- Spatial/Temporal Co-occurrence
- Evidence of Exposure or Mechanism
- Causal Pathway
- Stressor-Response Relationships from the Field
- Sediment
- Riffle/Pool
- Dissolved Oxygen
- Ammonia
- Metals
- Summary of Scores from the Case
- Increased % DELT
- Increased Relative Weight
- Decreased % Mayflies and Increased % Tolerant Macroinvertebrates
- Assemble Data from Elsewhere
- Stressor-Response Relationships from Laboratory Studies
- Mechanistically Plausible Cause
- Summary of Scores from Elsewhere
- Increased % DELT
- Increased Relative Weight
- Decreased % Mayflies and Increased % Tolerant Macroinvertebrates
- Evaluating Multiple Lines of Evidence
- Increased % DELT
- Increased Relative Weight
- Decreased % Mayflies and Increased % Tolerant Macroinvertebrates
- Identify Probable Cause
- Conclusion
Worksheet 1. Define the Case
In Ohio, biological impairment is defined by standard multimetric indices including the IBI, and ICI, and the modified index of well being (Ohio EPA 1989). These indices were used to identify reaches of the Little Scioto River (see Figure 1) that had impaired aquatic assemblages in comparison to the criteria for warm-water habitat (WWH) or modified warm-water habitat (MWH) designated uses.
The Little Scioto River has both WWH and MWH sections. WWH is a designation shared by the majority of Ohio's rivers and streams, and is narratively defined as supporting a balanced, reproducing aquatic community. The minimum criteria required to be in attainment of WWH standards are defined as the 25th percentile values of reference condition scores for a given index, site type, and ecoregion. The MWH designation is a nonfishable aquatic life use, and is designed to protect streams that have been too physically impacted or modified to meet WWH standards.
 Figure 1. A map highlighting the Little Scioto River (outlined in blue in the center of the map) generated using Enviromapper for Water.Of seven sites sampled in 1992, the highest IBI score was at an upstream site with a 33 out of a possible score of 60 (see Figure 2). The score translates into a fair ranking according to WWH standards. The remaining sites were described as severely impaired, with IBI scores between 25 and 12. Similarly, the ICI met WWH aquatic life use standards at the upstream site with a score of 38. The ICI score from RM 7.9 downstream was below MWH aquatic life use standards. Examination of the spatial distribution of the IBI, ICI and component metrics indicates that several distinct impairments occurred.
 Figure 2. IBI and ICI scores on the Little Scioto River. River miles are listed in upstream to downstream order from left to right.
The Biological Impairment and its Basis
The Little Scioto River near Marion, Ohio, was listed as an impaired waterbody on the 1998 303(d) List of Impaired Waters. In 1992, Ohio EPA determined that the river was biologically impaired (see Figure 1).
Specific Effects
The IBI and ICI were disaggregated to identify more specific effects that were responsive to the environmental changes, had a sufficient range of variation, and appeared to indicate distinctive mechanisms (Figure 3).
 Figure 3. Specific effects observed at the Little Scioto.
Specific effects associated with the impairment observed at RM 7.9 (Impairment A) include an increase in relative fish weight and DELT anomalies. For the invertebrates, the percentages of mayflies decreased, and the percentage of tolerant invertebrates increased (Table 1). The specific effects observed at RM 7.9 were sufficiently distinctive from the other locations on the Little Scioto to suggest that either additional or completely different causes may be influencing the assemblage at other sites on the stream. Those sites were not addressed in the current example, but are discussed in Norton et al. (2002), and Cormier et al. (2002).
| Response | Impairment A: Change in assemblage at site A relative to upstream site | Impairment B: Change in assemblage at site B relative to site A |
|---|---|---|
| Relative fish weight | Increased | Decreased |
| DELT anomalies | Increased | Increased |
| % Mayflies | Decreased | Decreased |
| Tolerant taxa | Increased | Increased |
The Investigation's Purpose
The purpose of the investigation is to inform decisions about how best to return the Little Scioto River to a condition that meets State biocriteria. As such, we considered stressors from both point and non-point sources including toxic contaminants in water and sediment, nutrients, and habitat degradation.
The Geographic Area Under Investigation
The Little Scioto River is located near Marion Ohio (see Figure 1). For the purposes of this example, the evaluation will be limited to identifying the probable cause of the biological impairment at RM 7.9 (Site A). The upstream site (RM 9.2) was used as a less-impaired reference site for comparison, and observations from six other downstream locations within the reach were brought in and analyzed as part of the case. For additional detail and an analysis of the biological impairments observed at other locations along the stream, see Norton et al. (2002) and Cormier et al. (2002).
References
- Cormier SM, Norton SB, Suter GW II, Altfater D, Counts B (2002) Determining the causes of impairments in the Little Scioto River, Ohio, USA: Part 2. Characterization of causes. Environmental Toxicology and Chemistry 21:1125-1137.
- Norton SB, Cormier SM, Suter GW II, Subramaniam B, Lin E, Altfater D, Counts B (2002) Determining probable causes of ecological impairment in the Little Scioto River, Ohio, USA: Part 1. Listing candidate causes and analyzing evidence. Environmental Toxicology and Chemistry 21:1112-1124.
- Ohio EPA (Environmental Protection Agency). (1989) Biological Criteria for the Protection of Aquatic Life. Volume III: Standardized Biological and Field Sampling and Laboratory Methods for Assessing Fish and Macroinvertebrate Communities. Ohio Environmental Protection Agency, Division of Water Quality Planning and Assessment, Ecological Assessment Section, Columbus OH. Procedure WQPA-SWS-3.
Worksheet 2. List Candidate Causes
- Increased fine sediments. Channel modification (i.e., narrowing, deepening and straightening of channel) leads to increased deposition of fine sediments.
- Altered pools and riffles. Channel modification (i.e., narrowing, deepening and straightening of channel) leads to deeper pools and fewer riffle habitats.
- Low dissolved oxygen (DO) concentration. Several pathways may contribute to low DO levels: decreases in large woody debris and loss of riffle habitats can decrease aeration; increased organic carbon loading (e.g., from wastewater inputs) can increase biological oxygen demand (BOD); and/or increases in nutrients (nitrogen and/or phosphorus) can stimulate algal production and thus BOD (due to respiration of living plants and/or decomposition of algal detritus).
- Increased algal biomass. Nutrient inputs lead to moderate increases in algal biomass. These increases are insufficient to significantly reduce DO, but sufficient to stimulate secondary production in the system (i.e., lead to increased fish weights) and to alter invertebrate community structure.
- Ammonia toxicity. Increases in nitrogen loading lead to increases in total ammonia within the system; this ammonia dissociates into un-ionized ammonia, which is toxic to aquatic organisms. This candidate cause can be significantly affected by pH levels and DO concentrations, as the relative abundance of unionized ammonia increases with increasing pH and decreasing DO (due to reduction of nitrate to ammonium). Because increases in photosynthesis can raise pH, increased nutrients can both directly and indirectly increase unionized ammonia concentrations.
- Metal toxicity.
- PAH toxicity.
 Figure 4. Map of the Little Scioto river showing locations of tributaries, roads, and possible sources.
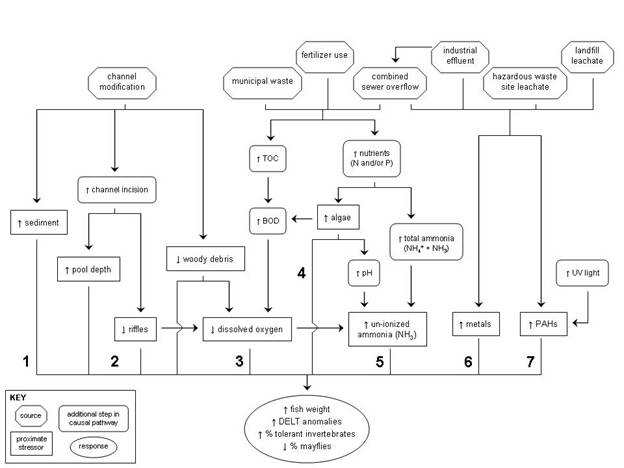 Figure 5. A conceptual model diagram of the six candidate causes for the Little Scioto stressor identification (revised August 2005).
Worksheet 3. Assemble Data from the Case
| Candidate cause | Relevant measurements |
|---|---|
| 1. Increased fine sediments | Channel score, embeddedness subscore, siltation subscore |
| 2. Altered pools and riffles | Channel score, pool score, riffle score |
| 3. Low dissolved oxygen | Dissolved oxygen, biological oxygen demand of water, riffle score, channel score |
| 4. Increased algal biomass | Nitrate and nitrite concentrations in water, total phosphorus concentrations in water |
| 5. Ammonia Toxicity | Ammonia concentrations in water |
| 6. Metal Toxicity | Metal concentrations in sediments, water and fish tissue |
| 7. PAH Toxicity | PAH concentrations in sediments, bile metabolites in fish |
| Sample medium | Parameter | Site designation and sample location (RM upstream from confluence with Scioto River) | Number of samples per location | ||||||
|---|---|---|---|---|---|---|---|---|---|
| Upstream Site | Site A | Site B | Downstream Sites | ||||||
| Fish | IBI and Miwb metrics | 9.2 | 7.9 | 6.5 | 5.7 | 4.4 | 2.7 | 0.3 | 2-3 |
| Macroinvertebrates | ICI Metrics | 9.2 | 7.9 | 6.5 | 5.7 | 4.4 | 2.1 | 0.4 | 1 |
| Sediment | Volatile chemicals, semivolatile chemicals, metals and cyanide, PCBs and pesticides | 9.5 | 7.9 | 6.5 | 5.8 | 4.4 | 2.7 | 0.4 | 1-3 |
| Water | Metals, phenolic compounds, ammonia, nitrates and nitrites (NO x), total phosphorus (P), and BOD | 9.2 | 7.9 | 6.5 | 5.8 | 4.4 | 2.7 | 0.4 | 1 |
| Water | Dissolved oxygen | 9.2 | 7.9 | 5.8 | 4.4 | 2.7 | 0.4 | measured continuously over 3 days |
|
| Physical Habitat | QHEI metrics | 9.2 | 7.9 | 6.5 | 5.7 | 4.4 | 2.7 | 0.3 | 1 |
| Fish Tissue | Pesticides, PCBs, metals, semivolatile compounds, and % lipid | 9.2 | 6.5 | 2.7 | 2-5 composite samples | ||||
| White Sucker Bile | PAH metabolites | 7.9 | 6.5 | 5.7 | 4.4 | 2.7 | 0.3 | 5-7 | |
| Chemical | Up-stream Site | Site A | Site B | Downstream sites (RM) | |||
|---|---|---|---|---|---|---|---|
| 5.8 | 4.4 | 2.7 | 0.4 | ||||
| BOD | 1 | 1 | 2.3 | 4.7 | 4.2 | 3.5 | 2.2 |
| Nitrate and Nitrite | 1.22 | 1.44 | 0.81 | 8.1 | 6.6 | 4.5 | 4.47 |
| Ammonia | ND | ND | 0.12 | 1.16 | 1.44 | 2.1 | 0.58 |
| Total phosphorus | 0.06 | 0.07 | 0.09 | 2.17 | 1.96 | 1.8 | 1.34 |
|
Dissolved oxygen (minimum) |
8.8 NA |
5.7 2.8 |
NA 1.9 |
4.2 4.2 |
4.3 3.2 |
3.0 2.0 |
4.4 2.5 |
| Coppera | ND | ND | 15 | ND | ND | ND | ND |
| Leada | ND | ND | 3 | 3 | ND | ND | ND |
| Zinca | ND | ND | ND | 18 | 12 | 13 | ND |
a. Units are µg/L
ND. Not Detected
| Parameter | Up-stream Site | Site A | Site B | Downstream sites (RM) | |||
|---|---|---|---|---|---|---|---|
| 5.7 | 4.4 | 2.7 | 0.4 | ||||
| Substrate embeddednessa | 2 | 1 | 1 | 1 | 1 | 1 | 1 |
| Siltb | 2 | 1 | 1 | 1 | 1 | 1 | 1 |
| Channelc | 17 | 10 | 10 | 10 | 10 | 10 | 7 |
| Poold | 11 | 8 | 8 | 8 | 6 | 8 | 8 |
| Rifflee | 6 | 0 | 0 | 0 | 0 | 0 | 0 |
a. Levels of embeddedness were scored from most to least (1=extreme, 2=moderate, 3=low, 4=none)
b. Levels of silt were scored from most to least (1=heavy, 2=moderate, 3=normal, 4=free)
c. Channels were scored from high to low quality (20=high quality)
d. Pools were scored from high to low quality (12=high quality)
e. Riffles were scored from high to low quality (8=high quality)
 Figure 6. Bile metabolites (μg/mg protein) measured in white suckers from the Little Scioto River. The grey horizontal line shows the upper limits of concentrations considered background for the state of Ohio. The number of fish sampled is shown above each bar. Vertical lines are standard errors. BAP = benzo[a]pyrene; NAPH= naphthalene. Source: Lin et al. (1996) and Cormier et al. (2000).
References
- Cormier SM, Lin ELC, Fulk FA, Subramanian B (2000) Estimation of exposure criteria values for biliary polycyclic aromatic hydrocarbon metabolite concentration in white suckers (Catostomus commersoni). Environmental Toxicology and Chemistry 19:1120-1126.
- Lin ELC, Cormier SM, Torsella JA (1996) Fish biliary polycyclic aromatic hydrocarbon metabolites estimated by fixed-wavelength fluorescence: comparison with HPLC-fluorescent detection. Ecotoxicology and Environmental Safety 35:16-23.
Worksheet 4. Spatial/Temporal Co-occurrence
Consider whether measurements of particular stressors (sediment, riffles/pools, dissolved oxygen, ammonia, metals, and PAHs) co-occur with observed biological impairment.
Data
Single observations of habitat quality were collected from the upstream site and the impaired site in 1992. PAH and metal concentrations were determined from fine sediments up to a depth of 15cm at each site. Dissolved oxygen and ammonia were measured in the water column.
Analysis
| Candidate Cause | Measurement | Upstream site | Site A | Exposure increased at Site A? |
|---|---|---|---|---|
| Increased fine sediments | Substrate embeddedness | 2 | 1 | Yes |
| Silt | 2 | 1 | Yes | |
| Altered riffles | Pool score | 11 | 8 | Yes |
| Riffle score | 6 | 0 | Yes | |
| Dissolved oxygen (mg/L) |
Dissolved oxygen | 8.8 | 5.7 | Yes |
| Metals (mg/kg) |
Chromium | 7.34 | 13.6 | Yes |
| Copper | 7.44 | 17.2 | Yes | |
| Lead | 12.1 | 19.2 | Yes | |
| Zinc | 3.06 | 79 | Yes | |
| PAHs (mg/kg) |
Anthracene | ND | ND | No |
| Benzo[a]anthracene | ND | ND | No | |
| Benzo[ghi]perylene | ND | ND | No | |
| Chrysene | ND | ND | No | |
| Fluoranthene | ND | ND | No |
Discussion
PAHs were not detected at the site, so PAH toxicity was refuted as a potential cause. Ammonia was not detected at the site, but water column measurements of ammonia are highly variable. Spatial co-occurrence for all other stressors was compatible with the stressor being the cause.
| Finding | Interpretation | Score |
|---|---|---|
| The effect occurs where or when the candidate cause occurs OR the effect does not occur where or when the candidate cause does not occur. | This finding somewhat supports the case for the candidate cause, but is not strongly supportive because the association could be coincidental. | + |
| It is uncertain whether the candidate cause and the effect co-occur. | This finding neither supports nor weakens the case for the candidate cause, because the evidence is ambiguous. | 0 |
| The effect does not occur where or when the candidate cause occurs OR the effect occurs where or when the candidate cause does not occur. | This finding convincingly weakens the case for the candidate cause, because causes must co-occur with their effects. | --- |
| The effect does not occur where or when the candidate cause occurs OR the effect occurs where or when the candidate cause does not occur, and the evidence is indisputable. | This finding refutes the case for the candidate cause, because causes must co-occur with their effects. | R |
| Candidate Cause | Result | Score |
|---|---|---|
| Sediment | Elevated sediment co-occurs with impairment | + |
| Pool/riffle | Poor pool/riffle condition co-occurs with impairment | + |
| Dissolved oxygen | Reduced DO co-occurs with impairment | + |
| Ammonia | Elevated ammonia not detected at site | --- |
| Metals | Elevated metals concentrations observed at impairment | + |
| PAHs | Elevated PAHs not detected at site | R |
Worksheet 5. Evidence of Exposure or Mechanism
Consider whether evidence exists for exposure to PAHs.
Data
Bile metabolites measured in white suckers from the Little Scioto River.
 Figure 7. Bile metabolites (ug/mg protein) measured in white suckers from the Little Scioto River.
Analysis/Discussion
Bile metabolites show evidence of exposure to PAHs at the site. Concentrations are low but no measurements at upstream site are available for comparison.
| Finding | Interpretation | Score |
|---|---|---|
| Data show that exposure or the biological mechanism is clear and consistently present. | This finding strongly supports the case for the candidate cause, but is not convincing because it does not establish that the level of exposure or mechanistic action was sufficient to cause the effect. | + + |
| Data show that exposure or the biological mechanism is weak or inconsistently present. | This finding somewhat supports the case for the candidate cause. | + |
| Data show that exposure or the biological mechanism is uncertain. | This finding neither supports nor weakens the case for the candidate cause. | 0 |
| Data show that exposure or the biological mechanism is absent. | This finding strongly weakens the case for the candidate cause, but is not convincing because the exposure or the mechanism may have been missed. | - - |
| Data show that exposure or the biological mechanism is absent, and the evidence is indisputable. | This finding refutes the case for the candidate cause. | R |
| Candidate Cause | Result | Score |
|---|---|---|
| PAHs | Evidence of PAH exposure observed | + |
Worksheet 6. Causal Pathway
Consider whether support exists for the causal pathway leading to dissolved oxygen.
Data
Total phosphorus (TP) and biochemical oxygen demand (BOD) were measured at the site
Analysis
| Data confirmed at site? | |
|---|---|
| Increased nutrients (N and/or P) | Yes |
| Increased algae | No data |
| Increased BOD | No |
| Data confirmed at site? | |
|---|---|
| Channel modified | Yes |
| Decreased woody debris | No data |
| Increased BOD | No |
Discussion
Pathway linking nutrients to DO requires elevated BOD. Since BOD is not elevated, this causal pathway seems unlikely. Pathway linking channel modification to DO requires data on woody debris. Since data are missing, evidence is ambiguous.
| Finding | Interpretation | Score |
|---|---|---|
| Data show that all steps in at least one causal pathway are present. | This finding strongly supports the case for the candidate cause, because it is improbable that all steps occurred by chance; it is not convincing because these steps may not be sufficient to generate sufficient levels of the cause. | + + |
| Data show that some steps in at least one causal pathway are present. | This finding somewhat supports the case for the candidate cause. | + |
| Data show that the presence of all steps in the causal pathway is uncertain. | This finding neither supports nor weakens the case for the candidate cause. | 0 |
| Data show that there is at least one missing step in each causal pathway. | This finding somewhat weakens the case for the candidate cause, but is not strongly weakening because it may be due to temporal variability, problems in sampling or analysis, or unidentified alternative pathways. | - |
| Data show, with a high degree of certainty, that there is at least one missing step in each causal pathway. | This finding convincingly weakens the case for the candidate cause, assuming critical steps in each pathway are known, and are not found at the impaired site after a well-designed, well-performed, and sensitive study. | - - - |
| Candidate Cause | Result | Score |
|---|---|---|
| Dissolved oxygen | Evidence of some steps are present for one pathway. | + |
Worksheet 7. Stressor-Response Relationships from the Field
Sediment | Riffle/Pool | Dissolved Oxygen | Ammonia | Metals
Sediment
Data
Data downstream from Site A were used to characterize the stressor-response relationship. Sediment levels are characterized with a qualitative substrate score.
Analysis
Mean substrate scores were plotted against the three specific variables. Where appropriate a curve was fit to the observations as a visualization aid. The point corresponding to observed substrate score and the biological response at Site A was overlaid on the plot (shown in red).
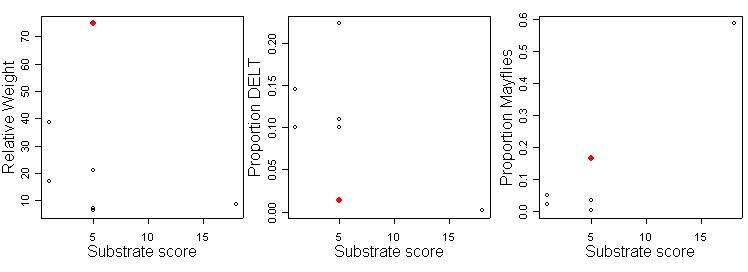 Figure 8. Comparisons of site conditions to stressor-response curves for the sediment candidate cause.
Discussion
None of the observed biological responses exhibited definitive trends across the observed range of substrate. However, uncertainty in the assessment of these trends is large, given that only six data points were available.
| Finding | Interpretation | Score |
|---|---|---|
| A strong effect gradient is observed relative to exposure to the candidate cause, at spatially linked sites, and the gradient is in the expected direction. | This finding strongly supports the case for the candidate cause, but is not convincing due to potential confounding. | ++ |
| A weak effect gradient is observed relative to expsoure to the candidate cause, at spatially linked sites, OR a strong effect gradient is observed relative to exposure to the candidate cause, at non-spatially linked sites, and the gradient is in the expected direction. | This finding somewhat supports the case for the candidate cause, but is not strongly supportive due to potential confounding or random error. | + |
| An uncertain effect gradient is observed relative to exposure to the candidate cause. | This finding neither supports nor weakens the case for the candidate cause, because the evidence is ambiguous. | 0 |
| An inconsistent effect gradient is observed relative to exposure to the candidate cause, at spatially linked sites, OR a strong effect gradient is observed relative to exposure to the candidate cause, at non-spatially linked sites, but the gradient is not in the expected direction. | This finding somewhat weakens the case for the candidate cause, but is not strongly weakening due to potential confounding or random error. | - |
| A strong effect gradient is observed relative to exposure to the candidate cause, at spatially linked sites, but the relationship is not in the expected direction. | This finding strongly weakens the case for the candidate cause, but is not convincing due to potential confounding. | -- |
| Candidate Cause | Specific Effect | Result | Score |
|---|---|---|---|
| Sediment | Relative weight | No apparent gradient | 0 |
| Proportion DELT | No apparent gradient | 0 | |
| Proportion mayflies | No apparent gradient | 0 |
Riffle/Pool
Data
Data downstream from Site A were used to characterize the stressor-response relationship. Riffle quality is characterized with a qualitative riffle score.
Analysis
Mean riffle scores were plotted against the three specific variables. Where appropriate a curve was fit to the observations as a visualization aid. The point corresponding to observed channel score and the biological response at Site A was overlaid on the plot (shown in red).
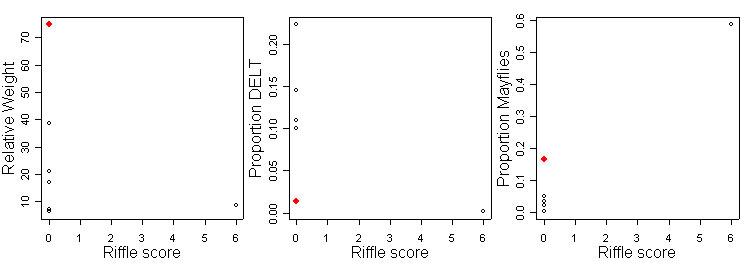 Figure 9. Comparisons of site conditions to stressor-response curves for the riffle/pool candidate cause.
Discussion
None of the observed biological responses exhibited definitive trends across the observed range of channel scores. However, uncertainty in the assessment of these trends is large, given that only six data points were available.
| Candidate Cause | Specific Effect | Result | Score |
|---|---|---|---|
| Riffle/pool | Relative weight | No apparent gradient | 0 |
| Proportion DELT | No apparent gradient | 0 | |
| Proportion mayflies | No apparent gradient | 0 |
Dissolved Oxygen
Data
Data downstream from Site A were used to characterize the stressor-response relationship. Dissolved oxygen was measured continuously at each location over a 3-d period with Datasonde continuous monitors.
Analysis
Observed minimum DO were plotted against the three specific variables. Where appropriate a curve was fit to the observations as a visualization aid. The point corresponding to observed minimum DO and the biological response at Site A was overlaid on the plot (shown in red).
 Figure 10. Comparisons of site conditions to stressor-response curves for the dissolved oxygen candidate cause.
Discussion
The observed proportion of mayflies and DELT seem reasonably consistent with the trends exhibited across the observed range of minimum DO values. However, uncertainty in the position of the fitted curve is large, given that only six data points were available. The observed value of relative weight is much larger than observed at other sites, and falls in the middle of the observed range of DO values.
| Candidate Cause | Specific Effect | Result | Score |
|---|---|---|---|
| Dissolved oxygen | Relative weight | No apparent gradient | 0 |
| Proportion DELT | Consistent with gradient | + | |
| Proportion mayflies | Consistent with gradient | + |
Ammonia
Data
Data downstream from Site A were used to characterize the stressor-response relationship.
Analysis
Ammonia concentrations were plotted against the three specific variables. Where appropriate a curve was fit to the observations as a visualization aid. The point corresponding to observed ammonia concentration and the biological response at Site A was overlaid on the plot (shown in red).
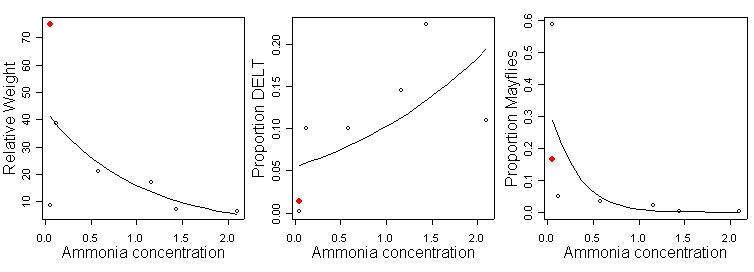 Figure 11. Comparisons of site conditions to stressor-response curves for the ammonia candidate cause.
Discussion
All of the biological responses exhibited definitive trends across the observed range of ammonia concentration. However, ammonia concentration was lower at the site than at other locations without the biological impairment (i.e., spatial co-occurrence was scored negatively).
| Candidate Cause | Specific Effect | Result | Score |
|---|---|---|---|
| Ammonia | Relative weight | Field stressor-response not applicable because of negative spatial co-occurrence score | NA |
| Proportion DELT | Field stressor-response not applicable because of negative spatial co-occurrence score | NA | |
| Proportion mayflies | Field stressor-response not applicable because of negative spatial co-occurrence score | NA |
Metals
Data
Data downstream from Site A were used to characterize the stressor-response relationship. Metals concentrations were characterized with Zn concentration.
Analysis
Mean Zn concentrations were plotted against the three specific variables. Where appropriate a curve was fit to the observations as a visualization aid. The point corresponding to observed Zn concentrations and the biological response at Site A was overlaid on the plot (shown in red).
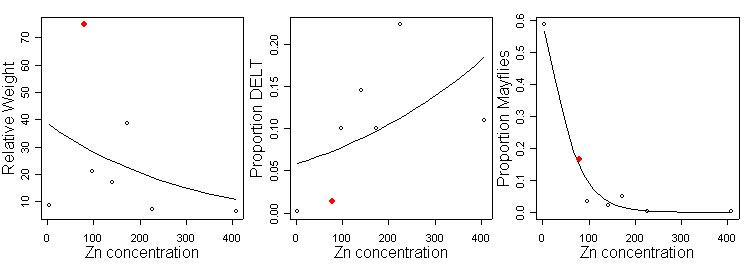 Figure 12. Comparisons of site conditions to stressor-response curves for the metals candidate cause.
Discussion
The proportion of mayflies exhibited a strong response to Zn. The change in percent DELT and relative weight also seemed correlated with Zn concentration, but observations at the site did not seem consistent with the overall gradient.
| Candidate Cause | Specific Effect | Result | Score |
|---|---|---|---|
| Metals | Relative weight | No apparent gradient | 0 |
| Proportion DELT | No apparent gradient | 0 | |
| Proportion mayflies | No apparent gradient | + |
Worksheet 8. Summary of Scores from the Case
Increased % DELT | Increased Relative Weight | Decreased % Mayflies and Increased % Tolerant Macroinvertebrates
Increased % DELT
| Types of Evidence | Algae | Ammonia | Dissolved Oxygen | Metals | PAHs | Riffles/Pools | Sediment |
|---|---|---|---|---|---|---|---|
| Spatial/Temporal Co-occurrence | NE | --- | + | + | R | + | + |
| Evidence of Exposure or Biological Mechanism | NE | NE | NE | NE | 0 | NE | NE |
| Causal Pathway | + | NA | + | NA | NA | NE | NA |
| Stressor-Response Relationships from the Field | NE | NA | 0 | 0 | NA | 0 | 0 |
| Manipulation of Exposure | NE | NE | NE | NE | NE | NE | NE |
| Laboratory Tests of Site Media | NE | NE | NE | NE | NE | NE | NE |
| Temporal Sequence | NE | NE | NE | NE | NE | NE | NE |
| Verified Predictions | NE | NE | NE | NE | NE | NE | NE |
| Symptoms | 0 | 0 | 0 | 0 | 0 | 0 | 0 |
Increased Relative Weight
| Types of Evidence | Algae | Ammonia | Dissolved Oxygen | Metals | PAHs | Riffles/Pools | Sediment |
|---|---|---|---|---|---|---|---|
| Spatial/Temporal Co-occurrence | NE | --- | + | + | + | R | + |
| Evidence of Exposure or Biological Mechanism | NE | NE | NE | NE | NE | 0 | NE |
| Causal Pathway | + | NE | NE | NE | NE | NE | NE |
| Stressor-Response Relationships from the Field | NE | NA | 0 | 0 | NA | 0 | 0 |
| Manipulation of Exposure | NE | NE | NE | NE | NE | NE | NE |
| Laboratory Tests of Site Media | NE | NE | NE | NE | NE | NE | NE |
| Temporal Sequence | NE | NE | NE | NE | NE | NE | NE |
| Verified Predictions | NE | NE | NE | NE | NE | NE | NE |
| Symptoms | 0 | 0 | 0 | 0 | 0 | 0 | 0 |
Decreased % Mayflies and Increased % Tolerant Macroinvertebrates
| Types of Evidence | Algae | Ammonia | Dissolved Oxygen | Metals | PAHs | Riffles/Pools | Sediment |
|---|---|---|---|---|---|---|---|
| Spatial/Temporal Co-occurrence | NE | --- | + | + | + | R | + |
| Evidence of Exposure or Biological Mechanism | NE | NE | NE | NE | NE | 0 | NE |
| Causal Pathway | + | NE | NE | NE | NE | NE | NE |
| Stressor-Response Relationships from the Field | NE | NA | 0 | 0 | NA | 0 | 0 |
| Manipulation of Exposure | NE | NE | NE | NE | NE | NE | NE |
| Laboratory Tests of Site Media | NE | NE | NE | NE | NE | NE | NE |
| Temporal Sequence | NE | NE | NE | NE | NE | NE | NE |
| Verified Predictions | NE | NE | NE | NE | NE | NE | NE |
| Symptoms | 0 | 0 | 0 | 0 | 0 | 0 | 0 |
Worksheet 9. Assemble Data from Elsewhere
| Chemical | Threshold Effects Level | Probable Effects Level |
|---|---|---|
| Benzo(a)pyrene | 0.03 | 0.32 |
| Fluoranthene | 0.04 | 0.32 |
| Benzo[a]anthracene | 0.03 | 0.28 |
| Chrysene | 0.02 | 0.41 |
| Benzo(g,h,i)perylene | 0.01 | 0.25 |
| Chromium | 32.3 | 119.4 |
| Copper | 28 | 101.2 |
| Lead | 37.2 | 81.7 |
| Zinc | 98.1 | 544 |
| Chemical | Criterion (units) | Source |
|---|---|---|
| Ammonia | 1.27 mg/L at pH 8.0 0.57 mg/L at pH 8.5 | U.S. EPA 1998 |
| Dissolved oxygen | 3.0 mg/L for Modified Warmwater Habitat | Ohio EPA 1996 |
| Nitrate-nitrite | 1.6 (mg/L) | Ohio EPA 1999 |
| Total phosphorus | 0.28 (mg/L) | Ohio EPA 1999 |
| Copper | 21 (μg/l) | U.S. EPA 1987 (hardness of 200 mg/l) |
| Lead | 7.7 (μg/l) | U.S. EPA 1987 (hardness of 200 mg/l) |
| Zinc | 190 (μg/l) | U.S. EPA 1987 (hardness of 200 mg/l) |
References
- Ohio EPA (Environmental Protection Agency) (1999) Association between nutrients, habitat, and the aquatic biota in Ohio rivers and streams. Ohio Environmental Protection Agency, Columbus OH. Technical Bulletin MAS/1991-1.
- U.S. EPA (1987) Quality Criteria for Water 1986. U.S. Environmental Protection Agency, Office of Water Regulations and Standards, Washington DC. EPA 440/5-86-001.
- U.S. EPA (1996) Calculation and evaluation of sediment effects concentrations of the amphipod Hyalella azteca and the midge Chironomus riparius. Assessment and Remediation of Contaminated Sediments (ARCS) Program. Great Lakes National Program Office, Chicago IL. EPA 905-R96-008.
- U.S. EPA (1999) 1999 Update of Ambient Water Quality Criteria for Ammonia. U.S. Environmental Protection Agency, Washington DC. EPA-822-R-99-014. 153 pp.
Worksheet 10. Stressor-Response Relationships from Laboratory Studies
Do observed concentrations of metals exceed probable effect levels determined from laboratory studies?
Data
Fine-grained sediments were collected in the upper 15 cm of bottom material with decontaminated steel scoops. Samples were analyzed for metals. Concentrations of toxics were compared to sediment screening values, expressed as probable effect levels, above which toxicity to the test animal Hyallela azteca have been found to occur frequently.
Analysis
| Candidate Cause | Measurement | Observed value | Probable effect level | Exceedance? |
|---|---|---|---|---|
| Metals (mg/kg) |
Cr | 13.6 | 119.4 | No |
| Cu | 17.2 | 101.2 | No | |
| Pb | 19.2 | 81.7 | No | |
| Zn | 79 | 544 | No |
Discussion
None of the measured metals exceeded probable effect levels.
| Finding | Interpretation | Score |
|---|---|---|
| The observed relationship between exposure and effects in the case agrees quantitatively with stressor-response relationships in controlled laboratory experiments. | This finding strongly supports the case for the candidate cause, but is not convincing because the correspondence could be coincidental due to confounding or differences in organisms or conditions between the case and the laboratory. | ++ |
| The observed relationship between exposure and effects in the case agrees qualitatively with stressor-response relationships in controlled laboratory experiments. | This finding somewhat supports the case for the candidate cause, but is not strongly supportive because the correspondence is only qualitative, and the degree of correspondence could be coincidental due to confounding or differences in organisms or conditions between the case and the laboratory. | + |
| The agreement between the observed relationship between exposure and effects in the case and stressor-response relationships in controlled laboratory experiments is ambiguous. | This finding neither supports nor weakens the case for the candidate cause. | 0 |
| The observed relationship between exposure and effects in the case does not agree with stressor-response relationships in controlled laboratory experiments. | This finding somewhat weakens the case for the candidate cause, but is not strongly weakening because there may be differences organisms or conditions between the case and the laboratory. | - |
| The observed relationship between exposure and effects in the case does not even qualitatively agree with stressor-response relationships in controlled laboratory experiments, or the quantitative differences are very large. | This finding strongly weakens the case for the candidate cause, but is not convincing because there may be substantial and consistent differences in organisms or conditions between the case and the laboratory. | -- |
| Candidate Cause | Result | Score |
|---|---|---|
| Metals | Metals concentrations did not exceed PEL | - |
Worksheet 11. Mechanistically Plausible Cause
Does a plausible mechanism exist for increased metals to cause the observed effects?
Analysis
| Specific Effect | Mechanism | References |
|---|---|---|
| Increased relative weight | No known mechanism | |
| Increased DELT | Metals cause fin erosion and lesions; Pb, Zn, and Cu cause deformities | 1,2,3 |
| Decreased percent mayflies | Metals cause lethal and sublethal effects on invertebrates | 4,5 |
Discussion
Decreased percent mayflies and increased DELT can be linked to metals contamination. No plausible mechanism is known by which increased metals leads to increased relative weight.
| Finding | Interpretation | Score |
|---|---|---|
| A plausible mechanism exists. | This finding somewhat supports the case for the candidate cause, but is not strongly supportive because levels of the agent may not be sufficient to cause the observed effect. | + |
| No mechanism is known. | This finding neither supports nor weakens the cause for the candidate cause. | 0 |
| The candidate cause is mechanistically implausible. | This finding strongly weakens the case for the candidate cause, but is not convincing because the mechanism could be unknown. | -- |
| Candidate Cause | Specific Effects | Result | Score |
|---|---|---|---|
| Metals | Increased relative weight | Implausible: no known mechanisms | -- |
| Increased DELT | Plausible | + | |
| Decreased percent mayflies | Plausible | + |
Worksheet 12. Summary of Scores from Elsewhere
Increased % DELT | Increased Relative Weight | Decreased % Mayflies and Increased % Tolerant Macroinvertebrates
Increased % DELT
| Types of Evidence | Algae | Ammonia | Dissolved Oxygen | Metals | PAHs | Riffles/Pools | Sediment |
|---|---|---|---|---|---|---|---|
| Mechanistically Plausible Cause | 0 | 0 | + | + | -- | -- | |
| Stressor-Response Relationships from Other Field Studies | - | NE | NE | NE | NE | NE | |
| Stressor-Response Relationships from Laboratory Studies | NE | NE | NE | NE | NE | NE | |
| Stressor-Response Relationships from Ecological Simulation Models | NE | NE | NE | NE | NE | NE | |
| Manipulation of Exposure at Other Sites | NE | NE | NE | NE | NE | NE | |
| Analogous Stressors | NA | NA | NA | NA | NA | NA |
Increased Relative Weight
| Types of Evidence | Algae | Ammonia | Dissolved Oxygen | Metals | PAHs | Riffles/Pools | Sediment |
|---|---|---|---|---|---|---|---|
| Mechanistically Plausible Cause | + | -- | -- | -- | + | -- | |
| Stressor-Response Relationships from Other Field Studies | NE | NE | NE | NE | NE | NE | |
| Stressor-Response Relationships from Laboratory Studies | NE | NE | NE | NE | NE | NE | |
| Stressor-Response Relationships from Ecological Simulation Models | NE | NE | NE | NE | NE | NE | |
| Manipulation of Exposure at Other Sites | NE | NE | NE | NE | NE | NE | |
| Analogous Stressors | NA | NA | NA | NA | NA | NA |
Decreased % Mayflies and Increased % Tolerant Macroinvertebrates
| Types of Evidence | Algae | Ammonia | Dissolved Oxygen | Metals | PAHs | Riffles/Pools | Sediment |
|---|---|---|---|---|---|---|---|
| Mechanistically Plausible Cause | + | + | + | + | + | + | |
| Stressor-Response Relationships from Other Field Studies | - | NE | NE | NE | NE | NE | |
| Stressor-Response Relationships from Laboratory Studies | NE | - | + | - | NE | NE | |
| Stressor-Response Relationships from Ecological Simulation Models | NE | NE | NE | NE | NE | NE | |
| Manipulation of Exposure at Other Sites | NE | NE | NE | NE | NE | NE | |
| Analogous Stressors | NA | NA | NA | NA | NA | NA |
Worksheet 13. Evaluating Multiple Lines of Evidence
Increased % DELT | Increased Relative Weight | Decreased % Mayflies and Increased % Tolerant Macroinvertebrates
Increased % DELT
| Types of Evidence | Algae | Ammonia | Dissolved Oxygen | Metals | PAHs | Riffles/Pools | Sediment |
|---|---|---|---|---|---|---|---|
| Consistency of Evidence | -- | -- | + | + | -- | -- | |
| Explanation of the Evidence |
Increased Relative Weight
| Types of Evidence | Algae | Ammonia | Dissolved Oxygen | Metals | PAHs | Riffles/Pools | Sediment |
|---|---|---|---|---|---|---|---|
| Consistency of Evidence | -- | --- | -- | -- | + | -- | |
| Explanation of the Evidence |
Decreased % Mayflies and Increased % Tolerant Macroinvertebrates
| Types of Evidence | Algae | Ammonia | Dissolved Oxygen | Metals | PAHs | Riffles/Pools | Sediment |
|---|---|---|---|---|---|---|---|
| Consistency of Evidence | -- | -- | + | -- | + | + | |
| Explanation of the Evidence |
Worksheet 14. Identify Probable Cause
| Probable Cause | |
|---|---|
| Degraded riffles/pools | |
| Evidence for: | Stressor co-occurs with effect |
| Cause is mechanistically plausible |
| Probable Causes | ||
|---|---|---|
| Decreased DO | Increased Metals | |
| Stressor co-occurs with effect | Stressor co-occurs with effect | |
| Evidence for: | Cause is mechanistically plausible | Cause is mechanistically plausible |
| Causal pathway exists | ||
| Probable Causes | |||
|---|---|---|---|
| Increased sediment | Degraded riffle/pools | Decreased DO | |
| Evidence for: | Stressor co-occurs with effect | Stressor co-occurs with effect | Stressor co-occurs with effect |
| Cause is mechanistically plausible | Cause is mechanistically plausible | Cause is mechanistically plausible | |
| Causal pathway established | |||
| Effect consistent with field stressor-response relationship | |||
| DO is less than minimum value from criterion |
Final Conclusion
Different candidate causes seem to be responsible for each of the biological effects that were considered in this analysis. However, closer examination of the candidate causes suggests a common thread. First, it is likely that the three causes associated with decreased mayflies (increased sediment, degraded pools and riffles and decreased DO) all derive from the same human activity, stream channelization. When the streamcourse is channelized, fine sediment can increase and riffle habitats can be degraded. Furthermore, the deepening of the channel and lost riffles can reduce dissolved oxygen. The deepened channel is also identified as a likely cause for the increased fish weight. Finally, reduced DO from the deepened channel may also be the cause of the increased proportion of DELT. Therefore, we identify the channelization of the stream as the most likely source of the observed impairment at this site.
Discussion
Increased relative weight: Only one candidate cause was found to be probable from the strength of evidence analysis. The available evidence suggested that the change in channel structure, and the resulting deepening of the stream was the most likely factor causing the increase in fish weight. Most other candidate causes were unlikely because no plausible mechanisms existed by which they could increase fish weights (sediment, dissolved oxygen, ammonia, metals). The argument for increased algae was weakened by a negative relationship between increased nutrients (used as a surrogate for algae) and relative fish weight. That is, the largest fish weight was observed at the site with one of the lowest nutrient concentrations. Although only one cause was identified, the evidence in support of this cause is weak, and further data collection is suggested. In particular, the effects of different sampling methodologies between the upstream site and the site of interest should be investigated. Increased relative weight is not a metric in either IBI or ICI, and so this effect is difficult to relate back to the original definition of the impairment.
Increased proportion of DELT anomalies: The cause of the change in DELT was either decreased DO or increased metal concentrations, but the available evidence does not distinguish between these two possibilities. The available lines of evidence for these two candidate causes were virtually identical. Decreased DO included the extra line of evidence that a causal pathway existed. Increased metals lacks this line of evidence only because the causal pathway is simple: increased metals can directly cause increased DELT. Other candidate causes were unlikely for a variety of reasons: Sediment and riffle/pool quality were unlikely causes because they lacked plausible mechanisms. Increased ammonia concentrations were not found at the site, and therefore an unlikely cause. Nutrient concentrations (used as a surrogate for increased autotrophs) were lower than the levels associated with increased DELT anomalies from other field studies in Ohio. Collecting additional evidence would be useful, particularly data that establishes relationships between DO or metal concentrations and the proportion of DELT anomalies. Information on the specific types of anomolies found would also be useful.
Decreased proportion of mayflies and increased proportion of tolerant macroinvertebrate taxa: Three candidate causes possibly explain the changes observed in the macroinvertebrate assemblage. Stressor-response relationships between sediment levels, habitat quality, and the observed biological responses were difficult to establish using the available data. However, changes in substrate composition and the quality of riffle habitat are known to have profound effects on macroinvertebrate assemblages. Several lines of evidence suggest that decreased DO is the cause of the observed changes. Collecting additional evidence linking sediment levels and habitat quality with the macroinvertebrate assemblage response would strengthen the argument for these causes.