Download Software
Overview
This section provides access to tools that you can download and use to analyze data. Links to three tools are described in the tabs on this page.
The tools you select depend on your analysis needs and your comfort level with programming. We recommend that inexperienced users begin with the tools that do not require programming expertise. A menu-driven package (CADStat) will allow you to conduct several types of data visualization and statistical analyses using a menu-driven interface. The Species Sensitivity Distribution (SSD) Generator provides detailed instructions and macros to generate SSDs. Users with knowledge of command-line statistical programming can begin with the more complex, analytically flexible tools.
- Tool 1: CADStat
A Menu-driven Package of Several Data Visualization and Statistical Methods based on a Java Graphical User Interface to R (JGR). - Tool 2: SSD Generator
A Microsoft Excel template that generates plots of the proportion of species affected at different exposure levels in laboratory toxicity tests. - Tool 3: Software Environment for Statistical Computing and Graphics (R) Command Line Tutorial.
A primer on the free statistical software package R, based on downloadable R scripts and sample data.
CADStat
CADStat is a menu-driven package of several data visualization and statistical methods. It is based on a Java Graphical User Interface to R. Methods in this package include: scatterplots, box plots, correlation analysis, linear regression, quantile regression, conditional probability analysis, and tools for predicting environmental conditions from biological observations. See the Helpful Links box for links to the CADStat installation instructions and Java GUI Interface to R.
SSD Generator
Species sensitivity distributions (SSD) display the proportion of species affected at different levels of exposure in laboratory toxicity tests. The SSD generator a Microsoft Excel Template that can be used to create customized SSDs. The SSD Generator depends on macros for operation, so you must select “enable macros” when you open the template.
The SSD Generator can be downloaded from the Helpful Links box. More information on using SSDs in causal analysis can be found on the Species Sensitivity Distribution page (follow the link in the helpful links box).
EPA (2005) provides more details on selecting data for SSDs and the method used in generating them.
R Command Line
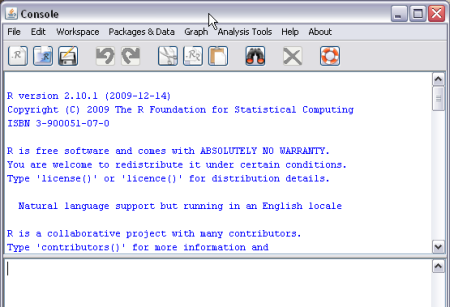
R is a free statistical software, providing access to a broad array of statistical tools. This page provides a brief outline of some commands that will help users begin to work with this software.
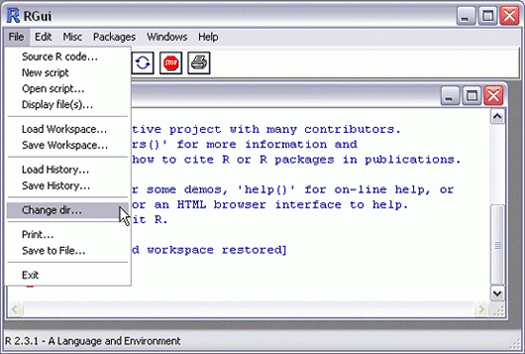
Workspace
Before beginning any computations, it is helpful to first set up a working directory. Using Windows Explorer (or any other comparable method), make a new folder for storing your work. Then, after launching R, select File: Change dir...
Basic syntax
Variable names in R can be composed of combinations of letters, numbers, underscores, and periods. They are case sensitive. Note that in this and all subsequent sections, R commands can be run by cutting and pasting text directly into the R Console window.
x, y, X, Y, flow.rate
| To assign a value to a variable, use the assignment operator, <- | |
|---|---|
| x <- 1 | # Assign a single value to the variable x |
| x <- c(1,3,2) | # Assign a vector of numbers to x |
| x <- c(T,F,T) | # Assign a vector of logical values to x |
| x <- list(colors = c("red", "blue", "black"), numbers = c(1,3)) | |
| # Assign a list of dissimilar objects to x | |
| The value of any variable can be examined by typing the variable name, or by using the print command: |
|---|
| x |
| print(x) |
| Simple mathematical and statistical operations can be performed on different numerical vectors | |
|---|---|
| x + y | # Addition |
| x - y | # Subtraction |
| x * y | # Multiplication |
| x / y | # Division |
| mean(x) | # Arithmetic mean |
| var(x) | # Variance |
| sum(x) | # The sum of all the elements of x |
| The most commonly used format for storing data is the data frame, which is a list of objects of the same length. Data frames allow one to combine logical, numerical, and factor data in a single data structure. | |
|---|---|
| site.name <- c("A", "B", "C", "D") | # A site label stored as a |
| # factor | |
| pH <- c(7.6, 6.0, 4.0, 8.2) | # Site pH stored as a |
| # numerical vector | |
| abund.baetis <- c(103, 204, 602, 301) | # Baetis abundance stored as |
| # a numerical vector | |
| sampled.spring <- c(T, T, F, T) | # Sampling season stored as a |
| # logical vector | |
| all.data <- data.frame(site.name, pH, abund.baetis, sampled.spring) | |
| # All data combined together | |
| # as a data frame | |
| Elements of a vector can be referred to in various ways. | |
|---|---|
| x[1] | # The first element of the vector x |
| x[1:3] | # The first three elements of vector x |
| x[c(T,T,F)] | # The first two elements of x (assuming that x |
| # has three elements) | |
| x[-1] | # All of x except for the first element |
| We can also refer to different subsets of a data frame in various ways. | |
|---|---|
| all.data$pH | # The element labeled "pH" from the data frame |
| # all.data | |
| all.data[, "pH"] | # The same column labeled "pH" |
| all.data[, 2] | # The second column of the data.frame |
| all.data[1,] | # The first row of the data.frame |
| Within R, you can access help pages on a particular command by typing, |
|---|
| help(<command name>) |
| For example: |
| help(glm) |
| help(mean) |