Getting Started with Data Analysis
Assembling data
On this Page
- Sources to Consider When Assembling Data
- Data from the Case
- Data from Elsewhere
- Tips for Assembling Data
A causal analysis may include data collected at the impaired site(s) and at local reference sites ("data from the case") as well as data from other locations ("data from elsewhere"). Data from the case are essential, but the sample size may be too small for robust statistical analysis and relationships found at the site should be confirmed by data from elsewhere, if possible. Data from elsewhere are used to develop background information on causal relationships and observations from similar situations that can be related to the case. Generally, both types of data are needed to complete a causal analysis.
Sources to Consider When Assembling Data

- Data collected from the target sites
- Local, regional or national biomonitoring datasets
- Online databases of field and laboratory data
- Scientific journals
- Industry and government publications
- Colleagues who have conducted similar studies
- Data generated by models
Data from the Case
The primary data from the case are the data used to determine if the site(s) can be classified as impaired. Data from the case includes samples of biota, water chemistry, sediments, stream habitat condition, and other attributes of the impaired and local reference sites (e.g., a site like Figure 1). They also may include land use/land cover data, geologic maps, or historical records needed to classify the sites.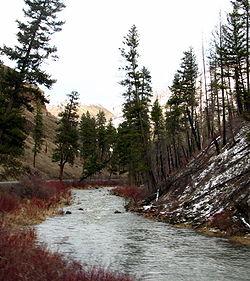 Figure 1. Local sample site.
Source: Wikipedia Commons.
Data from Elsewhere
Data from elsewhere usually form the bulk of the data used for causal analysis. These data may be obtained from other sites within the region, similar sites in other regions, laboratory studies, journal articles, industry and government publications, and other sources (e.g., Figure 2). After the data are assembled, they must be interpreted and related to observations from the case.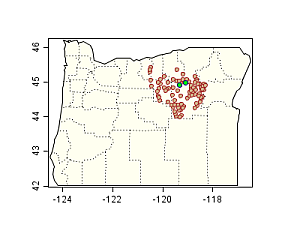 Figure 2. Western Environmental Monitoring and Assessment (EMAP) sample sites, illustrating data from the case (blue dots) and data from elsewhere (brown dots).
Monitoring programs run by city, county, state, and federal agencies provide information on local and regional field conditions which can be helpful to a causal analysis. Field data also can be used to evaluate stressors and responses under realistic environmental conditions. When using biomonitoring data, the measured variables, taxonomic resolution, and sampling approach used in selecting sites determine how data may be analyzed and how results may be used. For example, in stratified sampling designs, subsets may deliberately be represented in samples, with relative frequencies not equal to frequencies in the population of interest. Also, some probabilistic designs are associated with special methods of statistical analysis, such as special standard errors.
U.S. EPA Monitoring Data Available Online:
- Environmental Monitoring and Assessment Program (EMAP) and Regional Environmental Monitoring and Assessment Program (REMAP)
EMAP was a research program to develop the tools necessary to monitor and assess the status and trends of national ecological resources. Data sets generated in the course of EMAP's research are available to be searched and downloaded. The objectives of REMAP are to evaluate and improve EMAP concepts for state and local use, assess the applicability of EMAP indicators at differing spatial scales, and demonstrate the utility of EMAP for resolving issues of importance to EPA Regions and states. REMAP data are available online like EMAP data, but have smaller spatial and temporal scales. - EPA STOrage and RETrieval database (STORET)
The STORET Data Warehouse is U.S. EPA's repository of the water quality monitoring data collected by water resource management groups across the country. These organizations, including states, tribes, watershed groups, other federal agencies, volunteer groups and universities, submit datasets to the STORET Warehouse in order to make them publically accessible. - Wadeable Streams Assessment (WSA)
WSA is a survey of the biological condition of small streams throughout the U.S. conducted by the U.S. EPA in collaboration with states and tribes. The first WSA in 2004-2005 sampled 1,392 sites selected at random to represent the condition of all streams in regions that share similar ecological characteristics. Participants used the same standard methods at all sites, to ensure results that are comparable across the nation.
Peer reviewed journal articles and other publications may be obtained from libraries or online citation search engines. Although most journals and many scientific citation services charge fees for downloads or searches, many college and university libraries offer free access to the search engines and journals to which they subscribe, and also may provide assistance with literature searches. Other sources includes open-access data base compilations such as ECOTOXicology knowledgebase (ECOTOX) and Health and Environmental Research Online (HERO). For example, ECOTOX provides two open-access databases of citation information for selected stressor-response relationships in freshwater ecosystems. CADLink (CADDIS literature database) uses a keyword search to find stressor-response information for multiple stressor exposures reported in peer reviewed scientific literature. The Interactive Conceptual Diagram application uses a graphical user interface to find citations that support specific causal links in the conceptual model diagrams.
Note that databases are useful for identifying which data you will need and conducting initial exploratory comparisons, but the original source must be consulted if the information becomes critical to the causal assessment; in addition, many journals publish data on-line as supplements to the papers.
Observations from similar cases can yield insights into the current investigation, particularly if other investigators have implemented management actions or identified diagnostic symptoms. Unfortunately, these studies often are not published, and at present no central repository for such information exists. However, a small number of examples and case studies are available in Volume 3 of CADDIS.
Modeling data can be used as surrogates when insufficient field or laboratory data are available for a case. For example, a watershed model such as Better Assessment Science Integrating point & Non-point Sources (BASINS) can generate estimates of water quality parameters at specified locations.
Tips for Assembling Data
 Make the initial search broad. It is easy to overlook potentially relevant data for the stressors and biological impairments in your case by restricting the search to familiar sources.
- Use the metadata for data obtained from other sources. Metadata (data about the data) have the details needed to analyze a dataset and evaluate its quality. If metadata are not provided, locate website contacts or other users who may be able to supply them.
- Document the sources of original data and any alterations made (e.g. file merges, new fields, deleted observations). A file folder system and naming convention that allow users to easily track and identify data sources and versions will facilitate the assembly process.
- Set up read-only folders for original versions of data files. Always work on copies, not originals!
- Budget time to clean up and review final datasets prior to starting the analysis.
Matching Data
When relationships between two or more variables are analyzed, it is essential that these data are appropriately matched, and that the process for matching data and interpreting results is documented.
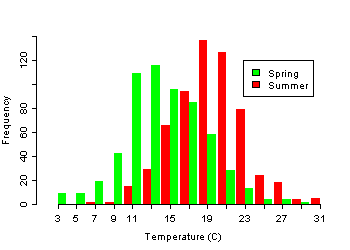 Figure 3. Histograms of stream temperatures from samples taken in spring (green) and summer (red).Here, the basic definition of matched data is a set of biological and environmental measurements taken at the same time and place. When comparing multiple locations (e.g. impaired and reference sites), samples also must be taken at the same time across locations. A simple example illustrating why unmatched samples may not be valid for causal analysis is shown in Figure 3, which plots seasonal shifts in stream temperature in one geographic region. Temperature measurements taken in spring cannot be paired with biological measurements taken in summer from the same site, because shifts in temperature and community structure are likely to co-occur. For the same reason, samples taken in different seasons clearly cannot be used to compare conditions across otherwise similar sites. Temporal and spatial matching become more complicated when considering differences in the stability and scale of environmental variables, and the modes of action by which they affect organisms. However, at the simplest level, matched observations of environmental conditions and biological responses reflect conditions at the same point in time and space.
Spatial heterogeneity and temporal stability should be considered when further deciding how data should be matched. For example, large woody debris occurs in localized areas and changes relatively little over time. In the absence of other disturbances, large woody debris need not be re-sampled as frequently as variables such as total suspended solids, which may vary over time and under different flow conditions at a site. Similarly, land cover data taken from national land cover databases need not be matched as closely in time to biological data as the water chemistry parameters at a site.
Relevant spatial and temporal scales also should be considered when deciding how to match data. The mechanism by which a stressor exerts its effect will determine the appropriate temporal scale. For example, "grab samples" of instantaneous stream temperature collected at the same time as a biological sample may be less relevant than the seasonal average stream temperature. Dissolved oxygen, on the other hand, is best measured when it reaches its diurnal extremes to determine if critical concentrations occur. Diurnal cycles also may be present in concentrations of stressors such as metals (Nimick et al. 2003) and nutrients (Scholefield et al. 2005). The potential for time lags between exposure and effects also should be considered. For example, if a stressor, such as a diversion of water flow, prevents salmon from reaching the sea on their out-migration, the effect (i.e., destruction of the salmon run) may not be observed for several years.
Organizing Data By Causal Pathway
The most compelling analyses demonstrate that a proximate stressor is associated with the biological response at the site. Other associations between steps in the causal pathway can increase confidence in the body of evidence for or against each candidate cause. These include the presence of a source for the stressor or intermediate steps that give rise to the stressor at the site.
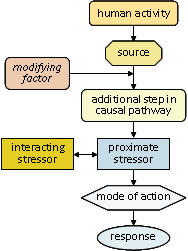 Figure 4. Conceptual diagram of elements in a causal pathway.Data from other locations and studies also can be related to the conceptual diagram. For example, results from other studies may be used to determine if the mechanisms or modes of action are reasonable, and the intensity of an intermediate step or interacting stressor are sufficient for a credible causal pathway. Finally, data from other locations and studies may be used to quantitatively model relationships between elements in the pathway, so that data from the impaired site can be compared to the model results.
- Conceptual diagrams for common stressors available for download from CADDIS Volume 2: Sources, Stressors & Responses.
- interactive on-line tool for constructing and modifying conceptual diagrams are available on CADDIS Volume 5: Causal Databases.
Measures of stressor sources are useful for identifying potential candidate causes, for completing the causal pathway, and, after the causal analysis, for source apportionment. However, source measurements can be difficult to use in a site-specific causal evaluation because they are often large in scale, can distribute stressors broadly and may contribute multiple stressors. Information on sources that produce many proximate stressors cannot be used to distinguish among those stressors. For example, increases in impervious surface area have been linked to proximate stressors such as increased flow extremes, temperature spikes, increased toxic substances, and decreased dissolved oxygen (Walsh et al. 2005, Schueler 2003). Therefore, measuring impervious surface does not help distinguish among these stressors.
Measures of the proximate stressor in the environment (e.g., degree of siltation, dissolved oxygen concentrations, or chemical concentrations) establish whether it occurs at elevated levels when compared to regional references or some other standard.
- When measurements of the proximate stressor are not available, surrogates can be sought. Information on the location and attributes of possible sources can be useful surrogates. This information is particularly important for intermittent stressors (e.g., high flow events) or stressors that degrade quickly (e.g., some pesticides).
- Measures of factors influencing or interacting with the proximate stressor are important in establishing whether complex causal pathways are complete. For example, one pathway by which excess nutrients affect stream biota is by stimulating periphyton growth, which respires or decays and reduces dissolved oxygen. To evaluate this pathway, data on dissolved oxygen concentrations may be supplemented with data on other steps in the causal pathway (e.g., nutrient concentrations and periphyton biomass). Evidence of an interacting stressor, such as low or fluctuating pH, alerts the analyst to consider possible effects on proximate stressors, such as increased solubility and bioavailability of metals or nutrients.
Measures of exposure, physiological mechanisms or other evidence of relevant modes of action may be used to verify that biologically significant exposure has occurred. Measurements might include biomarkers of exposure, tissue residues, or abundances of organisms representing different functional feeding groups (e.g., increase in filter feeding insects).
Measures of the biological impairment characterize the biological responses of primary interest (blue oval in Figure 4). If responses are very specific, they may be diagnostic of the cause. Be aware that biological measures also may be proximate stressors (e.g., an introduced predator) or steps in a causal pathway (e.g., carp as part of the causal network for increased suspended solids).
Helpful Tips
- Remember that data (evidence) may strengthen or weaken any given pathway.
- If data characterizing any portion of a pathway are absent, the role of that pathway in contributing to the impairment becomes less certain.
- Where there are sufficient data, structural equation models linking several strata within a conceptual diagram could be applied. This approach may be particularly useful for complex pathways (see the above example for nutrients).
Data Quality
Methods of data quality analysis and the standards for acceptable data are determined by the analyst, and may vary among data types and causal analyses. All causal assessments should include a written record of all activities and analyses conducted, and the decisions made, as part of the data quality plan. For data from other sources, the analyst has the responsibility of locating supporting documentation and evaluating whether the available data are of sufficient quantity and quality to support the causal analysis.
- Data Quality Assessment Tools
- Using Data From Other Sources - A Checklist for Quality Concerns
References
- Nimick DA, Gammons CH, Cleasby TE, Madison JP, Skaar D, Brick CM (2003) Diel cycles in dissolved metal concentrations in streams: occurrence and possible causes. Water Resources Research 39(9):1247-1264.
- Scholefield D, Le Goff T, Braven J, Ebdon L, Long T, Butler M (2005) Concerted diurnal patterns in riverine nutrient concentrations and physical conditions. Science of the Total Environment 344(1-3):201-210.
- Schueler T (2003) Impacts of impervious cover on aquatic systems. Center for Watershed Protection, Ellicott City MD. Watershed Protection Research Monograph No. 1.
- Walsh CJ, Roy AH, Feminella JW, Cottingham PD, Groffman PM, Morgan RP II (2005) The urban stream syndrome: Current knowledge and the search for a cure. Journal of the North American Benthological Society 24(3):706-723.
Volume 4: Authors