Estimating Taxon-Environment Relationships: Environmental Limits
Environmental Limits
Taxon-environment relationships expressed in terms of environmental limits attempt to capture the maximum or the minimum level of an environmental variable under which a taxon can persist. Environmental limits can be estimated by computing cumulative percentiles (CPs) from field data. An empirical CP is estimated for a given value of the environmental variable, x0 , as follows (Equation 2):
 EQUATION 2where I = 1 if xi < x0 and I = 0 if xi > x0 , and other variables are as defined in Equation 1 (see the Central Tendencies link to in the Quick Links box). For presence/absence data, the numerator is the number of occurrences of taxon j at sites in which the value of the environmental variable is less than the cutoff value, and the denominator is the total number of occurrences of taxon j. Plots of CP as a function of x0 are shown in Figure 4 for two genera. An environmental limit would be estimated by fixing CP at a prescribed value and then computing the x0 that corresponds to that value of CP for each taxon. Then, x0 quantifies the limiting conditions for that taxon. To estimate the maximum level of an environmental variable under which a taxon could persist, CP would be fixed at a relatively high value (e.g., 0.75).
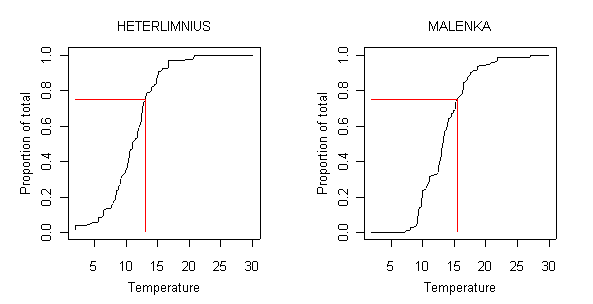 Figure 4. Empirical cumulative distribution method for defining environmental limits from relative abundance values of two genera. Cumulative percentile value shown is 0.75. Point at which red line intersects horizontal axis is the estimated environmental limit for that taxon. Horizontal axis in units of °C.