Computing Inferences: Weighted Average Inferences
Weighted Average Inferences
A weighted average inference is computed as the average of the single-value descriptors of the taxa observed at the site. A single-value descriptor of a taxon-environment relationship can quantify the central tendencies of a taxon with respect to an environmental gradient or the environmental limits of a taxon.
The computation of weighted average inference can be expressed as in Equation 9:
 EQUATION 9
where um,i is the weighted average inference at site i, N is the number of taxa, and uj is the single-value descriptor for taxon j. Yij is defined as previously: for presence/absence data, Yij = 1 when a taxon j is present, and Yij = 0 when taxon j is absent from site i; for abundance data Yij is the abundance of taxon j at site i.
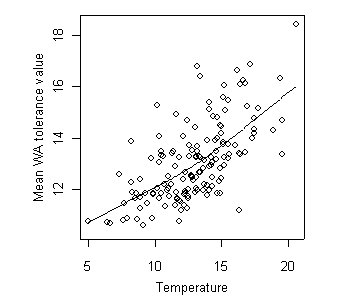 Figure 15. Relationship between weighted average inferences of temperature and observed temperature in Oregon. Solid line shows position of a smoothing spline fit through the data. Temperature on both axes in units of °C.An example of a weighted average inference is shown in Figure 15. Central tendencies for different genera were computed with regard to stream temperature using EMAP-West data. Then, these values were used to compute the weighted average inferences at sites in an independent dataset, collected from western Oregon. The weighted average inference at each site was plotted versus stream temperature measured at the same site.
The relationship between the weighted average inferences and observed temperature is relatively strong. Note though that the range of possible values of the weighted average inference is much narrower than the observed range. This "shrinkage" in the range of values is a consequence of the averaging operations that have been applied to compute the central tendencies of each taxon and to compute the inference.