An official website of the United States government.

This is not the current EPA website. To navigate to the current EPA website, please go to www.epa.gov. This website is historical material reflecting the EPA website as it existed on January 19, 2021. This website is no longer updated and links to external websites and some internal pages may not work. More information »

CADDIS Volume 4

SSD Plots

Back to: Species Sensitivity Distributions (SSDs)


Figure 1

An SSD plot showing the distribution of LC50s for arthropod species exposed to dissolved cadmium at greater than 15°C over 48-72 h, with 95% confidence intervals (dotted lines). Data obtained from U.S. EPA's ECOTOX database.
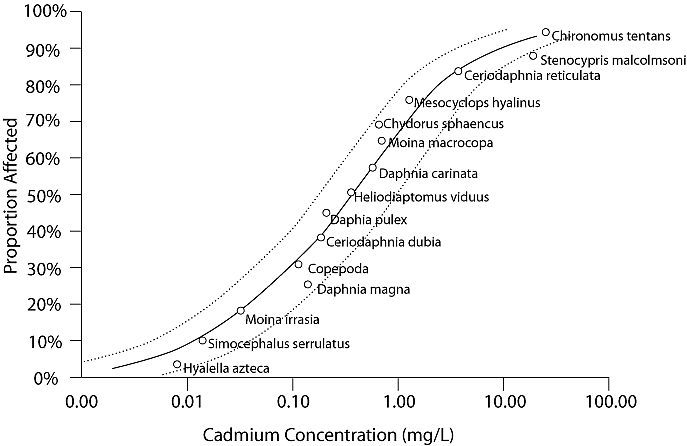
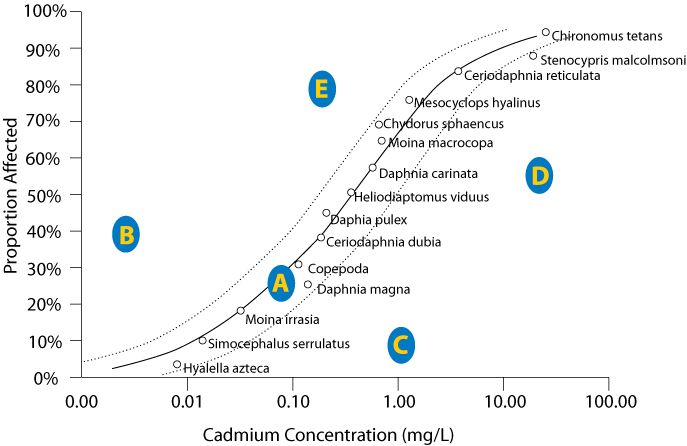
Figure 1. SSD plot showing the distribution of LC50s for arthropod species


Figure 2

An SSD plot depicting five hypothetical sites (A-E) with different observed concentrations of cadmium and different proportions of species affected. Higher values on the Y-axis reflect a more severe effect.

Figure 2. SSD plot depicting five hypothetical sites (A-E

Top of Page