The Charles River Initiative
- Clean Charles River Initiative
- Sound Science on the Charles River
- Charles River Watershed Report Cards
- Charles River in the News
Clean Charles River Initiative
 View a larger version of image.
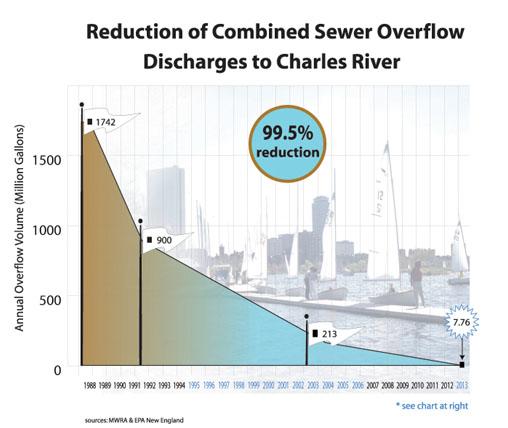
The controls MWRA implemented resulted in a dramatic reduction of CSO discharges to the lower Charles River. Reductions went from over 1.7 billion gallons per year prior to 1988, down to approximately 20 million gallons (MG) in 2014. Discharges are projected to drop to 6.88 MG in the next few years, and over 90% of those discharges will be treated at the Cottage Farm facility. This represents an approximately 99% decrease in CSO discharges to the Lower Charles River since 1988.
In 1995, EPA launched an ambitious effort make the Charles River both fishable and swimmable. Thanks to partners in numerous federal, state and local agencies as well as nonprofit groups, private institutions and citizens, the Clean Charles River Initiative has improved water quality in the river.
Using sound science, cutting-edge technologies and strong targeted enforcement, EPA and its partners have determined the causes of pollution and poor water quality in the River.
Since 1995, municipalities and the Massachusetts Water Resources Authority (MWRA) have made remarkable strides to improve water quality by reducing illicit sewage discharges to storm drain systems and Combined Sewer Overflows (CSOs), respectively.
The municipalities of the lower Charles River (including: Boston, Cambridge , Newton, Brookline Watertown and Waltham) have reduced sewage-contaminated stormwater flows through illicit storm drain connections. That effort has eliminated in excess of 48,000 gallons of sewage contaminated stormwater flowing into the River per day since 2004. This is in addition to the more than one million gallons per day of sewage contaminated stormwater that has been eliminated from municipal storm drain systems from Watertown to Boston harbor, an effort that began with the launch of the Charles cleanup effort in 1995.
Sewage discharges from CSOs to the river declined significantly as a result of the 2005 settlement between EPA and the MWRA. As a result of various CSO projects throughout the lower Charles (in many cases, eliminating CSOs entirely, MWRA has reduced CSO discharges by an impressive 99.5%).
We have made significant progress targeting bacterial sources of pollution in The River. But, there continue to be problems with excessive amounts of nutrients entering the river, especially phosphorus. See the Environmental Challenges for updated overview of these latest challenges.
Sound Science on the Charles River
The improvements in water quality on the Charles River are a direct result of sound science. EPA, U.S. Department of Interior Exit, U.S. Geological Survey Exit, Mass DEP Exit, Charles River Watershed Association Exit, Rocky Mountain Institute Exitand New England Interstate Water Pollution Control Commission Exithave conducted studies and produced reports analyzing the River.
Please see Reports and Links for a more complete view of reports on the Charles River.
Progress
Today we have a river that is safe for recreational boating virtually all of the time, and safe for swimming 70% of the time. It is a river that is now a resource for an active wind surfing community, an annual swim race and catch and release fishing. Indeed, we are much closer to the original goals of making the Charles both fishable and swimmable.
Charles River Watershed Report Cards
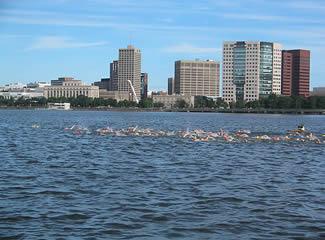 Swimmers on the Charles RiverEPA has been assigning a report card grade for the lower Charles River since calendar year 1995. Beginning in 2019, grades are assigned to six individual water body segments including two tributaries. Prior to 2019, a single grade was assigned to just the lower Charles River. EPA uses the Charles River Report Card to measure and evaluate progress towards meeting the State of Massachusetts bacterial water quality standards for swimming and boating as well as to assess general health of the watershed.
Grading Criteria 2019
Starting with 2019, the Charles River Watershed Association (CRWA), in coordination with EPA, will begin using an assessment method that encompasses all 80 miles of the mainstem river as well as two tributaries to provide the public with a more accurate assessment of local water quality conditions and greater transparency for all stakeholders. The report card will be based on E. coli data from thirty-nine sampling sites, collected monthly by CRWA volunteers. While the new grading system continues to measure the percentage of time water quality samples meet bacterial swimming and boating standards, it also incorporates cyanobacteria (toxic blue-green algae) blooms and combined sewer overflows (CSOs), which are both public health hazards, especially for boaters and anyone who comes into contact with the water. The Charles will now receive grades for six waterbody segments: the Upper Watershed (Hopkinton to Medfield), the Upper Middle Watershed (Sherborn to Dedham), the Lower Middle Watershed (Newton to Waltham), the Lower Basin (Watertown to Boston), the Stop River, and the Muddy River.
| 2019 | ||||||
|---|---|---|---|---|---|---|
| Overall | E. coli* | Other criteria** | ||||
| Site | Grade | Total | Grade | Total | Cyanobacteria | Combined Sewer Overflow |
| Upper Watershed | A- | 86.5% | A- | 86.5% | 0.0% | 0.0% |
| Stop River | A- | 86.3% | A- | 86.3% | 0.0% | 0.0% |
| Upper Middle Watershed | A | 94.1% | A | 94.1% | 0.0% | 0.0% |
| Lower Middle Watershed | A | 90.7% | A | 90.7% | 0.0% | 0.0% |
| Lower Basin | B | 75.5% | B | 78.7% | 1.3% | 1.9% |
| Muddy River | D- | 41.3% | D- | 41.3% | 0.0% | 0.0% |
*Figures represent average percentage of time that state bacterial standards are met.
**Figures represent percentage of time that each waterbody stretch is affected by a cyanobacterial bloom or combined sewer overflow.
For more information on how the grades are calculated please read the Frequently Asked Questions, review the report card map, and the data on CRWA's website.
Grading Criteria Prior to 2019
When assessing water quality to assign a grade to the lower Charles River prior to 2019, EPA used a comparison with previous years and general trends, as well as qualitative criteria, as follows:
A - met swimming and boating standards nearly all of the time
B - met swimming and boating standards most of the time
C - met swimming standards some of the time, and boating standards most of the time
D - met swimming and boating standards some of the time
F - fail swimming and boating standards most of the time
| Year | Overall Grade | % Meets Standards | % Meets Standards in Dry Weather Conditions | % Meets Standards in Wet Weather Conditions | |||
|---|---|---|---|---|---|---|---|
| Boating | Swimming | Boating | Swimming | Boating | Swimming | ||
| 2018 | B | 92 | 53 | 94 | 66 | 91 | 47 |
| 2017 | A- | 95 | 72 | 96 | 89 | 95 | 64 |
| 2016 | B | 86 | 55 | 98 | 61 | 80 | 53 |
| 2015 | B+ | 95 | 69 | 98 | 86 | 93 | 60 |
| 2014 | B+ | 91 | 65 | 100 | 86 | 86 | 53 |
| 2013 | A- | 96 | 70 | 97 | 84 | 95 | 63 |
| 2012 | B+ | 87 | 67 | 99 | 93 | 81 | 53 |
| 2011 | B | 82 | 54 | 96 | 89 | 74 | 35 |
| 2010 | B+ | 86 | 66 | 94 | 86 | 82 | 54 |
| 2009 | B+ | 93 | 62 | 92 | 69 | 94 | 58 |
| 2008 | B+ | 95 | 48 | 91 | 58 | 92 | 42 |
| 2007 | B++ | 100 | 63 | 100 | 84 | 100 | 50 |
| 2006 | B+ | 90 | 62 | 100 | 80 | 84 | 51 |
| 2005 | B+ | 97 | 50 | 97 | 59 | 96 | 32 |
| 2004 | B+ | 96 | 54 | 94 | 68 | 97 | 62 |
| 2003 | B- | 85 | 46 | 91 | 56 | 81 | 41 |
| 2002 | B | 91 | 39 | 100 | 71 | 86 | 21 |
| 2001 | B | 82 | 54 | 97 | 80 | 74 | 40 |
| 2000 | B | 92 | 59 | 94 | 82 | 91 | 46 |
| 1999 | B- | 90 | 65 | 100 | 71 | 85 | 62 |
| 1998 | C+ | 83 | 51 | 98 | 85 | 74 | 31 |
| 1997 | C | 70 | 34 | 87 | 56 | 61 | 22 |
| 1996 | C- | 57 | 21 | 94 | 40 | 45 | 15 |
| 1995 | D | 39 | 19 | ||||
The grade is based on a comparison with previous years and general trends. Given that the grades are based on a limited set of data, some annual fluctuations depending on weather are expected. Figures represent the percentage of time that state bacterial standards are met.
Charles River in the News
- 2020
- 2019
- 2018
- 2017
- 2016
- 2015
- 2014
- 2013
- 2012
- 2011
- 10/19/2011
Charles River Pollution Control District Pays Penalty for Clean Water Violations - 10/19/2011
International Award Recognizes Successful Ongoing Work to Clean the Charles River - 06/04/2011
At Annual Swim Event in Charles River, Yearly Water Quality Remains Good; EPA Grade from 2010 Monitoring: B+
- 10/19/2011
- 2010
- 2009
- 2008
- 2007
- 2006
- 09/27/2006
New Discharge Permit for Mirant Kendall Power Plant in Cambridge, Mass. Significantly Advances Protections for Charles River - 04/21/2006
Charles River Report Card: Continued Progress Cleaning 'That Dirty Water' - 03/16/2006
Massachusetts Water Resources Authority to Implement Sharp Reductions in Sewage Contamination of Charles River
- 09/27/2006
- 2005
- 2004
- 11/09/2004
EPA Orders Four Municipalities to Remove Illicit Discharges into the Charles River - 10/24/2004
"Love that Dirty Water" No Longer Applies to the Charles River; Crews in Head of the Charles Regatta Can Expect Cleaner Water - 09/09/2004
Public Hearing on Monday in Cambridge on Kendall Station Discharge Permit - 06/10/2004
EPA and DEP issue draft water discharge permit for Kendall power plant in Cambridge - 05/28/2004
NSTAR Agrees to $63,380 Settlement for Oil Spill Violations in Charles River - 04/21/2004
Charles River 'Report Card' Grade Drops to a "B-" -- Clean Up Efforts Continue; Outlying Communities Challenged to Match Boston and Cambridge's Efforts
- 11/09/2004
- 2003
- 10/07/2003
EPA Files Complaint Against NSTAR For Oil Spills From Transmission Pipes - 05/02/2003
EPA Announces $400,000 to Improve Water Quality in Charles River - 05/02/2003
EPA Announces $800,000 to Improve Fish Habitat and Water Quality in Narragansett Bay - 02/13/2003
EPA Selects Charles River Watershed Association for Innovative Water Trading Project
- 10/07/2003
- 2002
- 10/18/2002
EPA Honors Watershed Group, Students and Citizen Activist for Charles River Work - 07/03/2002
EPA, CZM, CRWA, and Save the Harbor/Save the Bay Promote Clean Boating on the Charles River During the Fourth of July Celebration - 05/02/2002
Charles River Earns a "B" Grade for Water Quality; Stormwater Pollution & Individual Action Priorities for Future Improvement
- 10/18/2002
- 2001
- 10/18/2001
EPA Announces New Initiatives Aimed at Restoring the Charles River - 04/27/2001
Charles River Earns Another "B" Grade, Cleanup Halfway to Swimmable Goal - 04/18/2001
MIT Commits to Three Environmental Projects and $150,000 Civil Penalty to Settle EPA Violations - 03/30/2001
USGS Studies Show Extent of Sediment Contamination and Saltwater Impacts on Charles River
- 10/18/2001
- 2000
- 1999
- 10/20/1999
EPA Announces that Rowers will Compete in a Charles River Cleaner than in Decades - 08/13/1999
EPA Settles Clean Water Act Case with Medway-Based Pollution Control District; Agreement Benefits Charles River and Franklin Well Field - 07/01/1999
EPA Proposes $134,580 Penalty Against City of Watertown for Environmental Violations - 06/04/1999
EPA's Initiative to Make the Charles River Swimmable by 2005 Wins National Recognition - 04/12/1999
EPA Gives Charles River a C-Plus and Announces New Coalition of Private Institutions - 04/01/1999
EPA Proposes $75,000 Penalty for Wastewater Treatment Violations on Charles River
- 10/20/1999
- 1998
- 10/16/1998
Good News for Charles River Rowers: The River is Getting Cleaner - 10/01/1998
EPA Settlement with Genzyme Requires Water Quality Studies in Charles River - 04/23/1998
EPA Report Card on Charles River Shows Water Quality Improvement - 03/02/1998
EPA Details Aggressive Pollution Prevention and Assistance Strategy for the Charles River
- 10/16/1998
- 1997
- 1996
- 1995