Climate Action Benefits: Market Impacts

Changes in the potential yields of agricultural and forestry products in response to climate change will shift land allocation, crop mix, and production practices throughout the U.S. These changes will affect commodity prices and the level of production and consumption of these goods.
On this page:
- Key findings
- Changes in crop price
- Changes in emissions
- Changes in consumer and producer surplus
- Approach
Additional information:
Key Findings
- Based on the projected changes in yields, global GHG mitigation is estimated to result in lower crop prices over the course of the 21st century compared to the Reference.
- Changes in crop and forest productivity alter related market dynamics, land allocation, crop mix, and production practices, which in turn affect GHG emissions and carbon sequestration from the agriculture and forestry sectors. Global GHG mitigation has a large effect on emissions fluxes in managed forests; however, the magnitude and direction of the effect are sensitive to climate model projection.
- Under both climate model projections, global GHG mitigation increases total economic welfare in the agriculture and forestry sectors by $43-$59 billion (discounted at 3%) through 2100 compared to the Reference. The magnitude of estimated economic welfare impacts in the agricultural sector is much larger than in the forestry sector.
Changes in Crop Price
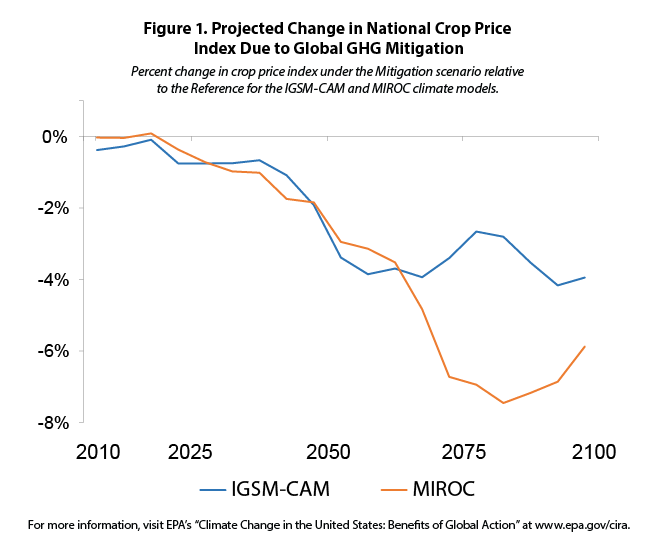
As described in the Crop and Forest Yields section of this report, global GHG mitigation is projected to result in generally higher crop yields in the U.S. relative to the Reference. As a result, mitigation is projected to result in less pressure on land resources and declining commodity prices. As shown in Figure 1, climate projections from both the IGSM-CAM and MIROC climate models show steep declines in a broad index of crop prices starting around 2040. Projections using the drier MIROC climate model result in greater declines in crop prices by the end of the century than those using the wetter IGSM-CAM model. Adverse effects of climate change on crop and food prices, which are largely avoided in the Mitigation scenario, are consistent with the findings of the assessment literature.23
Figure 1. Projected Change in National Crop Price Index Due to Global GHG Mitigation
 Percent change in crop price index under the Mitigation scenario relative to the Reference for the IGSM-CAM and MIROC climate models.
download the figure; download the data
Changes in Emissions
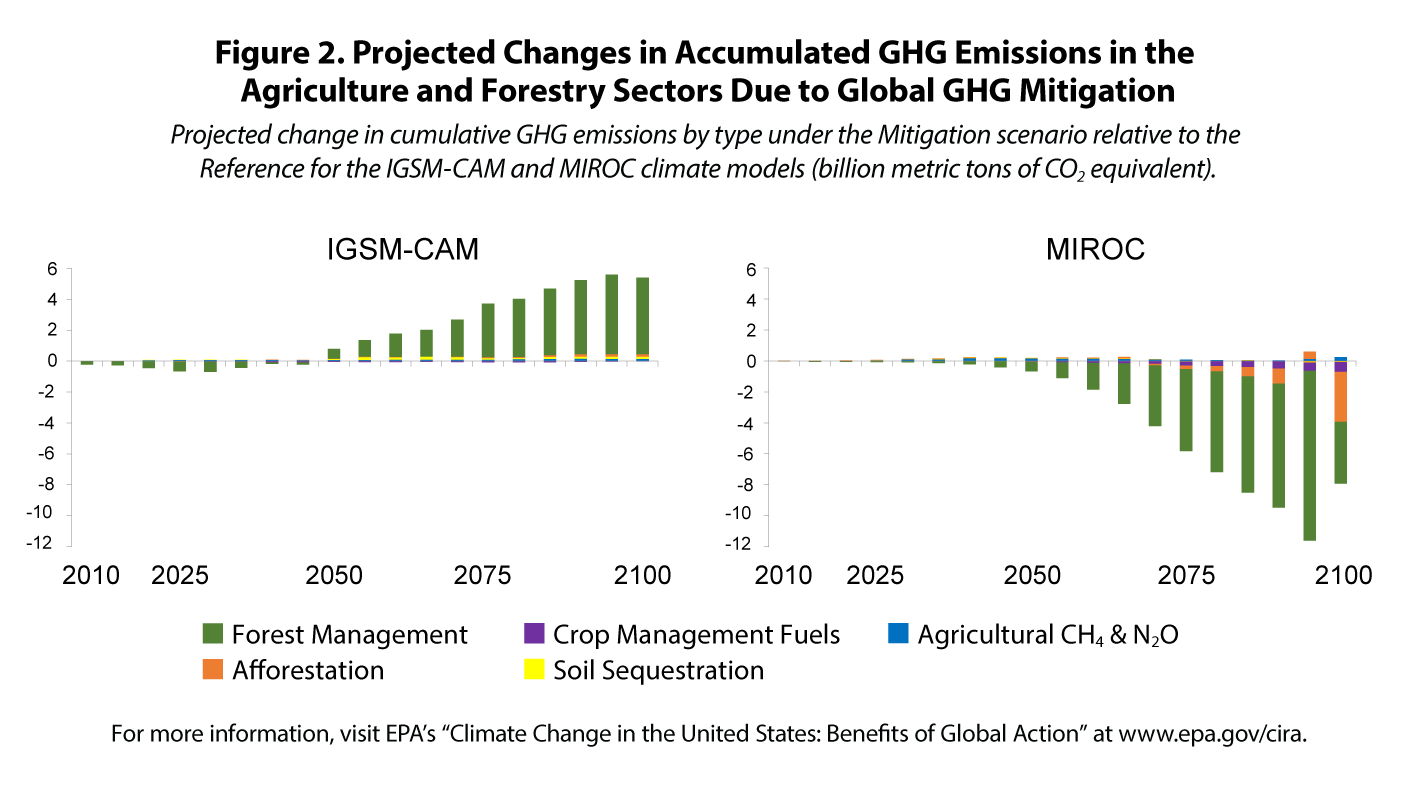
Changes in land allocation, crop mix, and production practices in turn affect GHG emissions from agriculture and forestry practices. Figure 2 shows the estimated changes in cumulative GHG emissions under the Mitigation scenario compared to the Reference using projections from the IGSM-CAM and MIROC climate models. Under the IGSM-CAM projections, GHG mitigation is estimated to increase net GHG emissions from these sectors in the second half of the century. The increase is due in large part to the generally lower forest productivity that is projected to occur under the Mitigation scenario compared to the Reference, as the latter has higher productivity driven by the generally warmer and wetter future climate, as well as the enhanced positive effects of CO2 fertilization (see the Crop and Forest Yields section). Thus, global GHG mitigation results in less forest carbon sequestration over time. Higher levels of carbon storage in forests under the generally warmer and wetter future of the IGSM-CAM Reference scenario are consistent with the findings presented in the Carbon Storage section of this report.
Under the MIROC climate projections, on the other hand, forest productivity is enhanced under the Mitigation scenario relative to the Reference, and forests take up and store more carbon. In addition, although emissions from livestock agriculture rise, GHG emissions related to crop production generally decline as less area is devoted to crops due to higher yields.
Figure 2. Projected Changes in Accumulated GHG Emissions in the Agriculture and Forestry Sectors Due to Global GHG Mitigation
 Projected change in cumulative GHG emissions by type under the Mitigation scenario relative to the Reference for the IGSM-CAM and MIROC climate models (billion metric tons of CO2 equivalent).
download the figure; download the data
Changes in Consumer and Producer Surplus
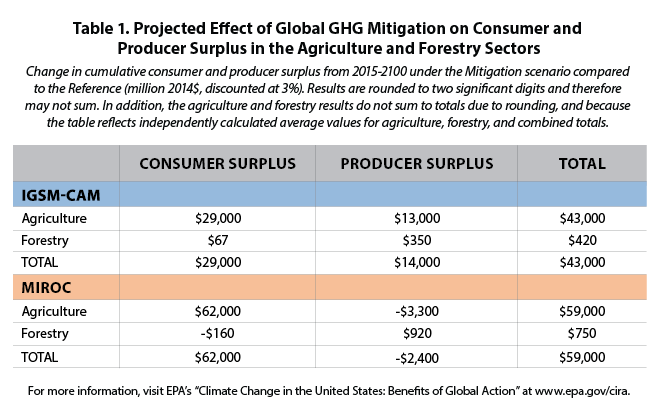
The changes in crop prices and the level of production and consumption of agriculture and forestry products have important implications for the economic welfare of consumers and commodity producers. The analysis measures these effects through changes in consumer and producer surplus,24 as summarized in Table 1. Using both climate model projections, global GHG mitigation increases total economic welfare (well-being) in the agriculture and forestry sectors by $43 to $59 billion (discounted at 3%) through 2100 compared to the Reference. Estimated consumer surplus is higher under the drier MIROC conditions than it is under the IGSM-CAM, primarily due to the larger crop yields under the Mitigation scenario compared to the Reference (see the Crop and Forest Yields section).
The effect of global GHG mitigation on producer surplus varies depending on the climate model used. The IGSM-CAM climate projections result in an increase in producer surplus, though not as substantial as the projected increase in consumer surplus. The drier MIROC projections result in a slight decrease in producer surplus due to the substantial increase in crop yields and resulting decrease in prices.
Table 1. Projected Effect of Global GHG Mitigation on Consumer and Producer Surplus in the Agriculture and Forestry Sectors
 Change in cumulative consumer and producer surplus from 2015-2100 under the Mitigation scenario compared to the Reference (million 2014$, discounted at 3%). Results are rounded to two significant digits and therefore may not sum. In addition, the agriculture and forestry results do not sum to totals due to rounding, and because the table reflects independently calculated average values for agriculture, forestry, and combined totals.
download the figure
Approach
The CIRA analysis uses the Forest and Agricultural Sector Optimization Model with Greenhouse Gases (FASOM-GHG)25,26 to estimate changes in market outcomes associated with projected impacts of climate change on U.S. crop and forest yields. As described in the Crop and Forest Yields section, projected yields across regions and crop/forest types are generated by the EPIC and MC1 models. FASOM-GHG is driven by changes in potential yield from EPIC and MC1 for each of the five initializations of the IGSM-CAM climate model for both the Reference and Mitigation scenarios,27 as well as the drier MIROC climate model.
FASOM-GHG simulates landowner decisions regarding crop mix and production practices, and projects the allocation of land over time to competing activities in both the forest and agricultural sectors and the associated impacts on commodity markets.28 Given the changes in potential yields projected by EPIC and MC1, FASOM-GHG uses an optimization approach to maximize consumer and producer surplus over time.29,30 The model is constrained such that total production is equal to total consumption, total U.S. land use remains constant (with the potential movement of land from forest to agriculture and vice versa), and non-climate drivers in the agriculture and forestry sectors are consistent between the scenarios to isolate the effect of climate change. In addition, the analysis assumes no price incentives for avoiding GHG emissions or carbon sequestration in the agriculture and forestry sectors (i.e., the sectors do not participate in the global GHG mitigation policy). Finally, although the EPIC simulations assume that crops can be irrigated to a level that eliminates water stress, the FASOM-GHG simulations include shifts in water availability for irrigation based on data obtained from the water supply/demand framework described in the Water Quality section of this report.31
For more information on the CIRA approach and results for the FASOM-GHG agriculture and forestry market impacts analysis, please refer to Beach et al. (2015)32