The Next-Generation Air Quality Model
Motivation for Improving Combined Meteorological and Air Quality Models
Air quality modelers need an efficient multiscale global system to account for the effects of air pollution from overseas while resolving detailed air quality impacts in the U.S. The current two-way Weather Research and Forecasting (WRF)-CMAQ system requires a series of nested domains![]() domainsThe area in space or time period over which a prediction is made. with increasing resolution to span hemispheric (~100 km) to local scales (~1 km). This protocol has been useful in the past but is fundamentally inefficient and has been shown to result in interpolation errors and discontinuities when transitioning from larger domains to smaller ones. The traditional approach does not account for the effects of small-scale processes on large-scale phenomena.
domainsThe area in space or time period over which a prediction is made. with increasing resolution to span hemispheric (~100 km) to local scales (~1 km). This protocol has been useful in the past but is fundamentally inefficient and has been shown to result in interpolation errors and discontinuities when transitioning from larger domains to smaller ones. The traditional approach does not account for the effects of small-scale processes on large-scale phenomena.
 From left to right this figure shows typical US EPA WRF/CMAQ model domains from the 108 km hemispheric scale, 12 km continental scale United States, regional 4 km to a local 1 km domain over the Washington DC-Baltimore area.
Learn more about the Model for Prediction Across Scales (MPAS).EXIT
Approach for the Next-Generation Air Quality Model
New meteorological models have been developed that include seamless mesh refinement from global to local scales. These are the future of multi-scale global air quality models. Such mesh structures are ideal for air quality modeling since they cover the entire globe with a coarse mesh, but can resolve areas of interest like the United States with a much finer mesh. Or, further refinement down to a region of the United States, a specific city or even many large urban centers where air quality is still a health problem. For our Next Generation Air Quality Model, we have chosen the Model for Prediction Across Scales (MPAS) to provide the computational grid mesh and the meteorology. The air quality component is in the process of redesign from the current 3D CMAQ model to a 1D column model (vertical dimension only) where the horizontal transport of chemical concentrations will be handled by MPAS. This design will result in flexibility, efficiency and consistency.
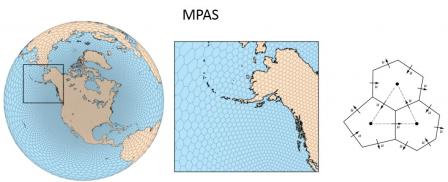
 The transition from large grid cells at the global scale to fine cells at the near-urban and urban scales is seamless (left). The size of the grid cells can change dramatically, albeit smoothly, over hundreds of kilometers (middle). The angles, side lengths and even the number of sides of each grid cell is variable throughout the model grid.
Performance of MPAS for an Annual Simulation
After the first series of modification to the MPAS model to produce more accurate retrospective simulations, a full annual simulation for 2016 was conducted (previous testing simulated only one month). The evaluation is currently being detailed in a forth coming journal article. Among the features added to MPAS were four-dimensional data assimilation, the Pleim-Xiu land surface model (P-X LSM), the asymmetric convective planetary boundary layer model 2 (ACM2), an updated Kain-Fritsch convection parameterization with feedback to the radiation schemes and a dynamic convective time scale, and processing for soil nudging inputs (see references below for details). Furthermore, we have updated our tools for data visualization (i.e.; VERDI) and model evaluation to work with this new global model data.
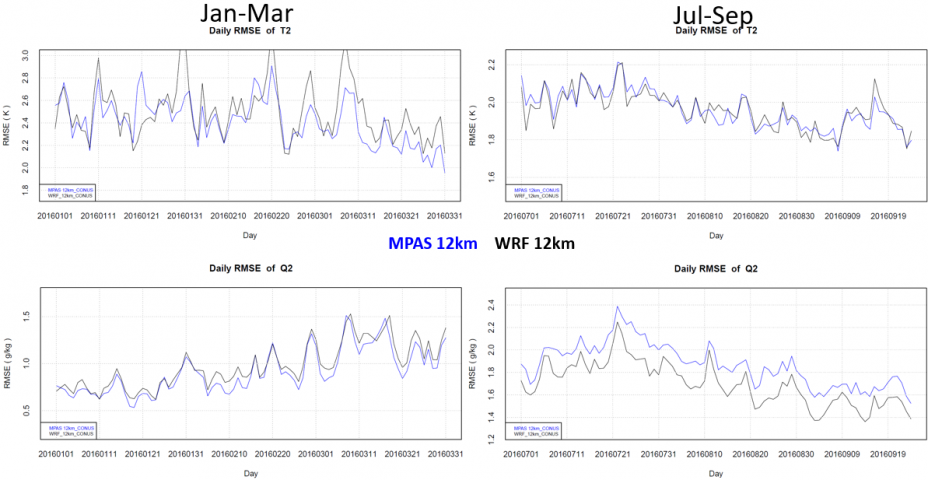
When we evaluate a meteorology model, high-quality observations are essential. We use an internally developed Atmospheric Model Evaluation Tool (AMET) that employs observations from the National Oceanic and Atmospheric Administration (NOAA) Meteorological Assimilation Data Ingest System (MADIS). Common aspects of the meteorology that are evaluated are near-surface meteorology, meteorology aloft, and precipitation. Below is a comparison of WRF and MPAS daily errors of modeled near surface temperature (T2) and moisture (Q2). Except for summer moisture, on most days MPAS performs as well as, or better than WRF.
 Daily errors of MPAS and WRF for temperature and moisture during the winter and summer of 2016.
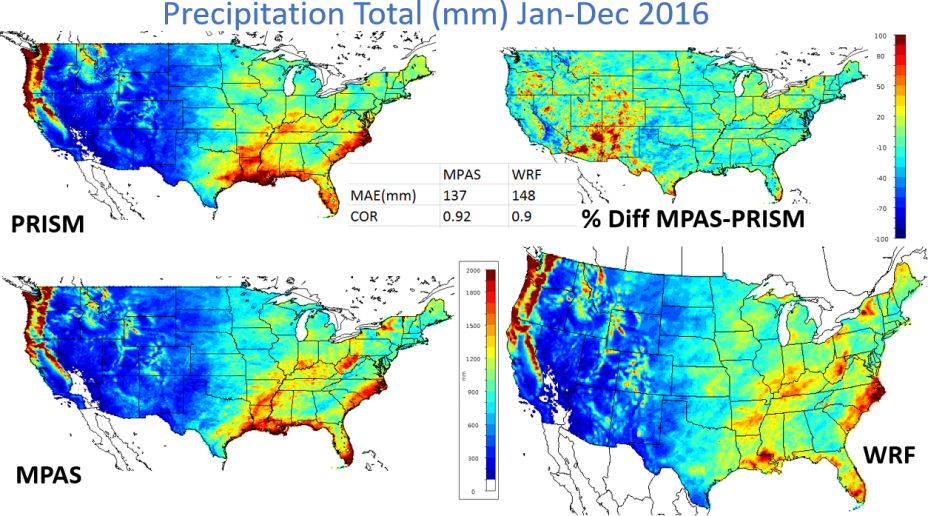
The ability to reproduce precipitation is one of the most important aspects of any meteorological model simulation. AMET allows for a daily or monthly evaluation of precipitation using PRISM Climate Group datasets. The figure below shows monthly precipitation data accumulated for all of 2016, showing that MPAS precipitation is consistent with the PRISM observation-based datasetfor the annual total. Furthermore, MPAS actually has a slightly lower mean absolute error (MAE) and a higher correlation (COR) than WRF.
 Observed (PRISM) and modeled (MPAS and WRF) precipitation for 2016. Percent difference between MPAS and PRISM is also provided along with mean absolute error (MAE) and correlation (COR).
Many model evaluation studies are limited to surface meteorology. AMET allows direct comparison of MPAS and WRF with global balloon soundings of the atmosphere to understand the model accuracy throughout the layer of the atmosphere where weather occurs (troposphere). The figure below shows errors at all global balloon sounding sites valid for Jan-Dec 2016. Modeled temperature errors are generally 1 deg Celsius/Kelvin or less (1.8 deg F) and wind speed errors around 2 meter per second (~4.5 mph). This level or error is considered low in weather modeling literature. The figure also demonstrates our ability to evaluate global models using AMET.
 Figure shows the error of temperature and wind speed throughout the layer in the atmosphere where weather occurs. Error levels are considered very low for a meteorology model.
Performance of a Prototype MPAS-CMAQ
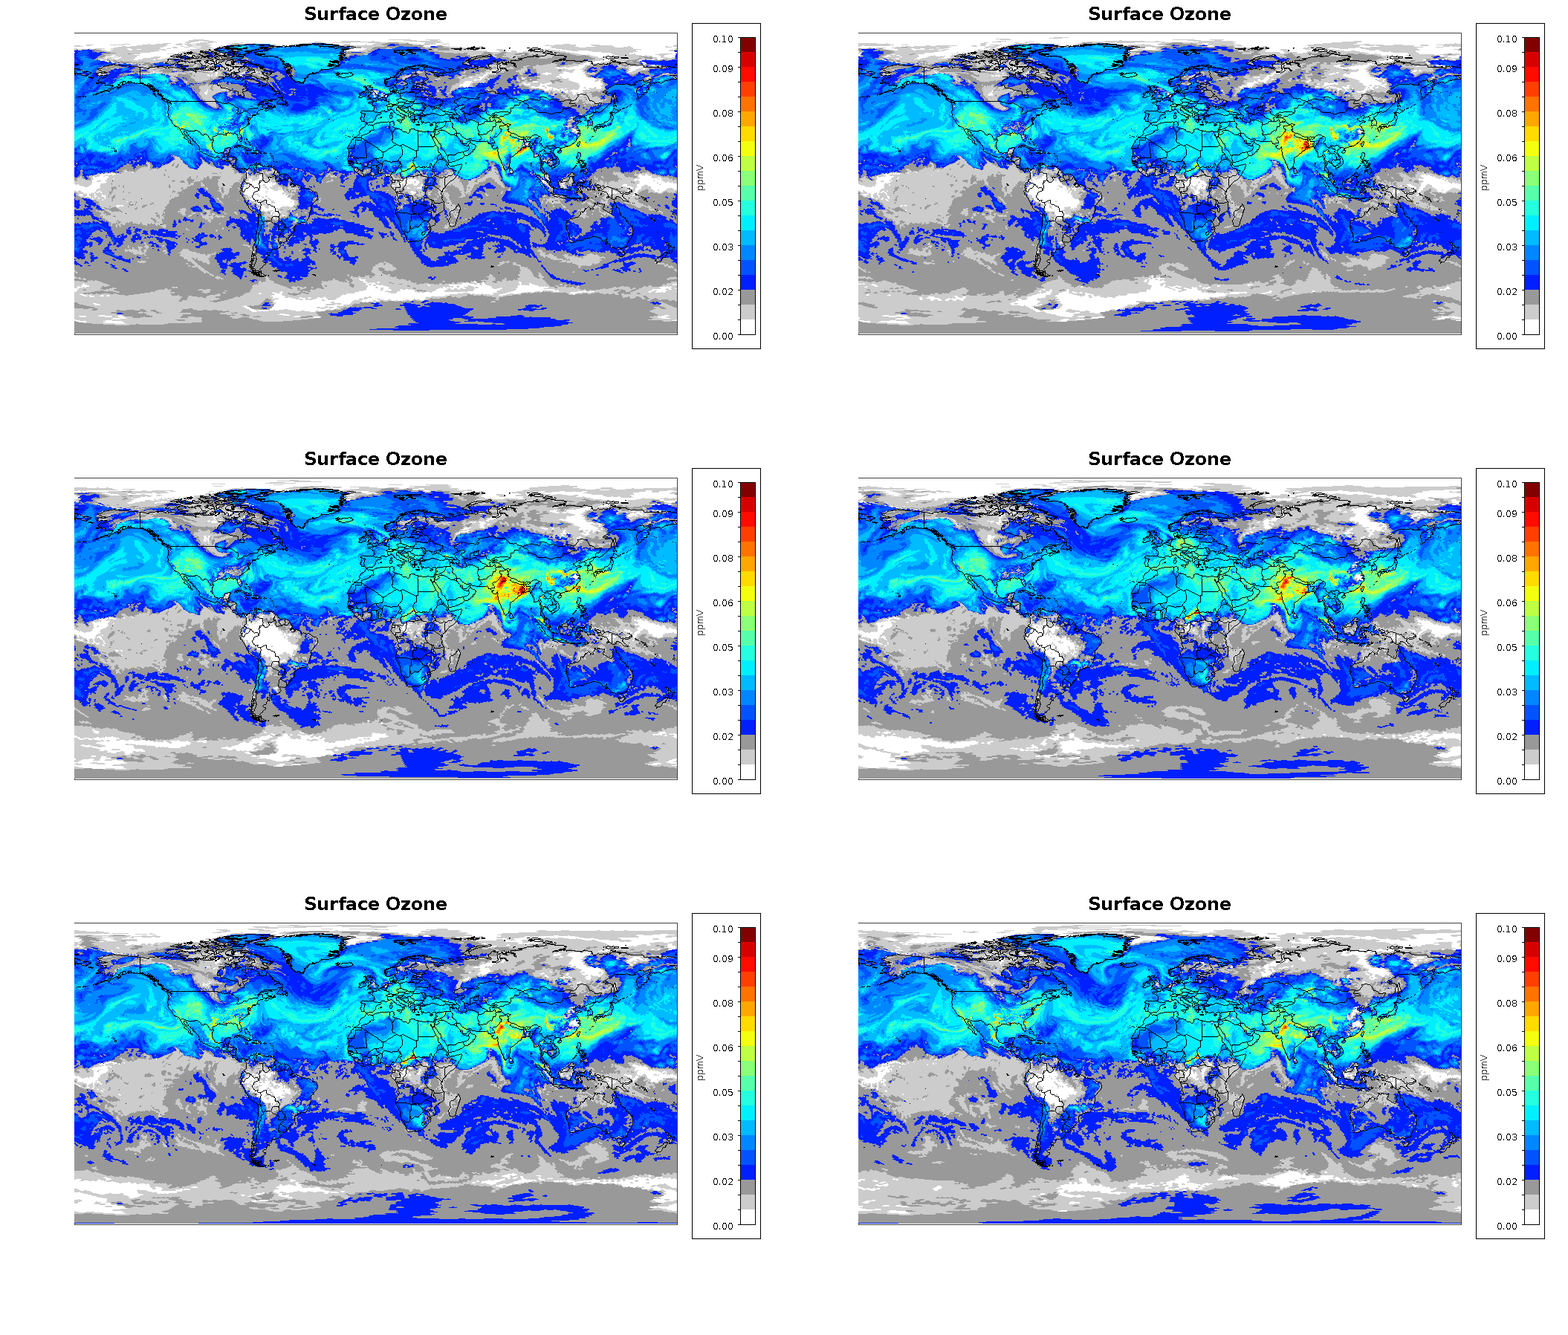
While development is in the early stages, a version of the coupled MPAS-CMAQ model has been tested for the limited period of July 2013. Additional updates have been made since then, such as including CMAQ5.3, with plans for simulating all of 2016, so these initial results below are more of an "in the ballpark test" at this stage. Below is a figure that shows the mean of the daily eight-hour maximum ozone that was observed globally along with the attempted reproduction by the MPAS-CMAQ model. While there are certainly differences that our longstanding WRF-CMAQ would simulate better, this early version of MPAS-CMAQ is reasonable in most areas of the world. A key problem with these early simulations is the lack of model spin-up. Global models require a long spin-up period, especially for ozone, which is not only formed from primary emission sources near the surface, but also exists in the upper atmosphere in very high concentrations that are transported down to the surface via tropospheric-stratospheric exchange and vertical transport processes. There is no set spinup guideline, but it does take a month to months or even longer for proper spinup of global models. For our first annual 2016 MPAS-CMAQ simulations we plan a three month spinup.
 Observed and simulated MPAS-CMAQ ozone. Values are average daily eight-hour maximum ozone for July 11-31, 2013 period.
 Animation of global surface ozone from the prototype MPAS-CMAQ simulation on October 29, 2016.
Potential Air Quality Model Configurations
The Next Generation Air Quality Model will be a one-dimensional (vertical column) air quality model coupled with a 3D meteorology model. We envision three configurations of flexible systems:
- Online-coupled global model with seamless grid refinement
- 2-way coupling between MPAS and AQ column model working simultaneously to simulate meteorological and air-quality processes around the globe
- Online-coupled regional model
- 2-way coupling between WRF and AQ column model working simultaneously to simulate meteorological and air-quality processes over a limited area.
- If MPAS is eventually adapted for limited-area use, it could be used in place of WRF to simulate meteorological processes in the combined system
- Offline regional
- 1-way coupling (sequential) of meteorology (WRF) and the same AQ column model but with additional components for horizontal transport to simulate air-quality without feedbacks to the meteorology
References
Bullock Jr., O. R., Foroutan, H., Gilliam, R. C., and Herwehe, J. A.: Adding four-dimensional data assimilation by analysis nudging to the Model for Prediction Across Scales – Atmosphere (version 4.0), Geosci. Model Dev., 11, 2897-2922, https://doi.org/10.5194/gmd-11-2897-2018, 2018.
Pleim J., Wong D., Gilliam R., Herwehe J., Bullock R., Hogrefe C., Pouliot G., Ran Limei, Murphy B., Kang D., Appel W., Mathur R., and Hubal E., The New Generation of Air Quality Modeling Systems., EM, Oct 2018.
