Ports Primer: 7.2 Air Emissions
Near-port communities are often disproportionately impacted by air emissions due to port operations, goods movement![]() goods movementThe distribution of freight (including raw materials, parts and finished consumer products) by all modes of transportation including marine, air, rail and truck. operations and other industries that may be co-located with ports. Air emissions at ports also impact regional air quality.
goods movementThe distribution of freight (including raw materials, parts and finished consumer products) by all modes of transportation including marine, air, rail and truck. operations and other industries that may be co-located with ports. Air emissions at ports also impact regional air quality.
EPA sets national air quality standards that are implemented by states and tribal agencies. There is also growing momentum within the port sector to reduce emissions and improve air quality.
Pollutants from Diesel Engines1
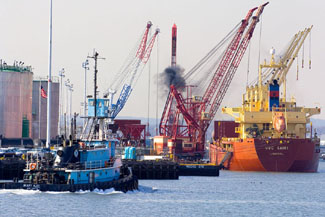 Reducing pollutants from diesel engines is a significant concern for ports and near-port communities. Equipment, vehicles and marine vessels that burn diesel fuel are the primary source of combustion-related emissions at port facilities.
Pollutants released by diesel engines include particulate matter (PM), nitrogen oxides, (NOX), carbon monoxide (CO), sulfur oxides (SOX), and air toxics. The level of sulfur in the fuel being used is directly proportional to the level of SOX emissions generated. Levels of other pollutant emissions are related to the physics and chemistry of the diesel combustion process. Additionally, some of the pollutants are inversely linked in the combustion process. This means that engines designed to reduce one pollutant will naturally raise the levels of another pollutant. Therefore, engine modifications must be combined with other emission control technologies in order to effectively reduce the levels of all four of the primary diesel emission pollutants. It is good news for improving community health that EPA has developed regulations requiring production of cleaner diesel engines. However, diesel equipment lasts a long time so the turn over to newer equipment can take quite a while.
Because of the environmental and health impacts of diesel emissions, many ports that have developed air quality programs include a central focus on reducing NOX, SOX and PM.2 Diesel engines are also a source of greenhouse gas (GHG) emissions and affect climate change. A number of strategies can help reduce impacts of diesel emissions on air quality, as well as on global climate concerns such as impacts on ecosystems, sea level, weather patterns and agriculture.
 Emission Inventories
Air emissions inventories can be a good way for ports to establish a baseline of sources of emissions from various port equipment, marine vessels, trucks and cars operated on the port, and from key freight corridors near the port. Emissions inventories can also be used to measure the impact of future port changes, and future hypothetical emission inventories and scenarios can be used to evaluate potential new strategies to reduce diesel emissions. EPA has methodologies for conducting ports and goods movement mobile source emission inventories.
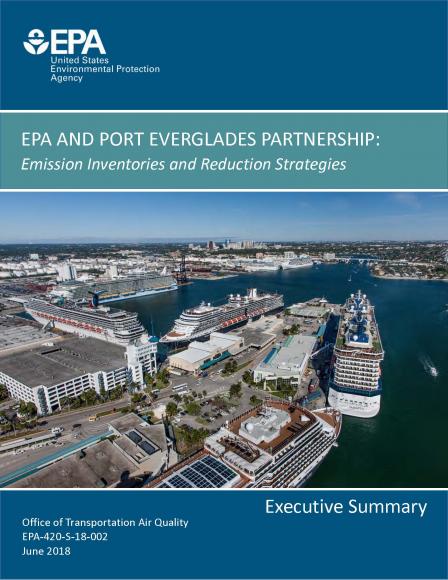
An example of this type of air emissions inventory was conducted through an EPA partnership with Broward County's Port Everglades which lead to the development of:
- The Port Everglades 2015 Baseline Air Emissions Inventory. Exit
- Emission reduction scenarios and inventories for the Port Everglades boundary for future analysis years.
- Separate emissions estimates for certain mobile source corridors outside the Port Everglades boundary.
- Documentation of methods, lessons learned, and practical examples that can inform other ports, related agencies, and stakeholders.
Emission Reduction Approaches3
The chart below describes various approaches to reducing air emissions.
| Type of Reduction Approach | Reduction Principles |
|---|---|
| Technology-oriented approaches |
|
| Program-oriented approaches |
|
| Operational approaches |
|
For more information on specific technologies that can support and supplement these approaches:
- Clean Cargo (PDF) (64 pp, 6 MB, About PDF) Exit
- Developing Port Clean Air Programs (PDF) (70 pp, 1.1 MB, About PDF) Exit
- National Port Strategy Assessment
- Clean Air Guide for Ports and Terminals: Technologies and Strategies to Reduce Emissions and Save Energy (PDF) (26 pp, 3.2 MB, About PDF) Exit
Clean Air Programs at Ports
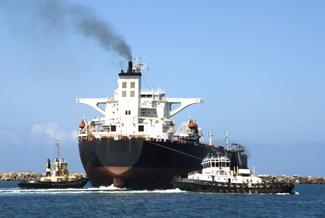 Clean air programs manage a port’s efforts to address air emissions. Often the program has a Clean Air Director and an action plan, which may include:4
- An emissions baseline and pollutant prioritization
- Emission reduction targets
- A technical plan for meeting emission reduction goals
- A tracking system to monitor progress
- A communications plan for sharing the program’s initiatives and achievements
Programs may also rely on a Clean Air Team, which could include port staff and other stakeholders, for input in developing and implementing the action plan and monitoring its results.
Momentum to address air emissions has been growing across the international port industry. In 2007, the International Association of Ports and Harbors (IAPH) adopted a resolution on Clean Air Programs for Ports during the 25th World Port Conference.5
For more information: Developing Port Clean Air Programs (PDF) (70 pp, 1.1 MB, About PDF) Exit
Metropolitan Planning Organizations and Regional Air Quality
 A Metropolitan Planning Organization (MPO) coordinates regional transportation policymaking efforts. They also act as a channel for federal and state funding for transportation projects. MPOs can be found in urban areas with populations greater than 50,000. For more on the general responsibilities of MPOs related to transportation, see the Land Use and Transportation Planning section.
MPOs in nonattainment areas participate in interagency consultation on air quality and transportation planning with other relevant federal, state, and local agencies. During the transportation planning process, MPOs with this responsibility can identify transportation strategies and alternatives that will help reduce transportation-related air pollution emissions.
The following terms may be useful for readers interested in digging deeper into this topic:
- State Implementation Plan (SIP): A plan developed by the state environmental protection agency that demonstrates how the state will meet the National Ambient Air Quality Standards (NAAQS), as outlined in the Clean Air Act.
- Metropolitan Transportation Plan (MTP) and Transportation Improvement Program (TIP): A long-range (e.g., 20 year) transportation plan for the metropolitan area and a short-range (e.g., 4 year) program of planned transportation improvements developed by the MPO.
- Transportation Conformity Process: Transportation conformity is required under Clean Air Act to ensure that federally and approved highway and transit activities are consistent with the purpose of the SIP. This means that transportation activities will not cause new air quality violations, worsen existing violations, or delay timely attainment of the relevant standards. Transportation conformity applies to nonattainment and maintenance areas for transportation-related pollutants: ozone, PM2.5, PM10, carbon monoxide, and nitrogen dioxide. In these areas, conformity must be determined for MTPs, TIPs, and federal highway and transit projects before they can be funded.
- General Conformity Rule: Although not the responsibility of an MPO, all federal actions that do not fall under the Transportation Conformity Process must also conform with the State Implementation Plan (SIP).
For more information: The Transportation Planning Process
To find your local MPO: MPO Database
EPA SmartWay Program6
SmartWay® is an EPA program that reduces transportation-related emissions by creating incentives to improve fuel efficiency in the full transportation supply chain![]() supply chainA network that supplies goods or services from the source of production through the point of consumption. A supply chain is considered to include people, organizations, transportation infrastructure, information technology and physical locations such as manufacturing plants, distribution centers, and retail outlets.. EPA helps SmartWay Partners move more goods, more miles, with lower emissions and less energy. Partners include: large and small trucking companies, rail carriers, logistics companies, commercial manufacturers, retailers, and other federal and state agencies.
supply chainA network that supplies goods or services from the source of production through the point of consumption. A supply chain is considered to include people, organizations, transportation infrastructure, information technology and physical locations such as manufacturing plants, distribution centers, and retail outlets.. EPA helps SmartWay Partners move more goods, more miles, with lower emissions and less energy. Partners include: large and small trucking companies, rail carriers, logistics companies, commercial manufacturers, retailers, and other federal and state agencies.
 Since 2004, the SmartWay Program has:
- Established over 3,700 partners
- Saved $30 billion in fuel costs by reducing fuel use by over 9 billion gallons
- Avoided the creation of 103 million metric tons of air pollution (carbon dioxide, nitrogen oxides and particulate matter)
By design, SmartWay’s achievements in improving fuel efficiency and reducing greenhouse gases and air pollution are primarily national in scope.
For more information: SmartWay Program
North American Emission Control Area7
In 2010, the International Maritime![]() MaritimeLocated on or near the sea. Commerce or navigation by sea. The maritime industry includes people working for transportation (ship, rail, truck and towboat/barge) companies, freight forwarders and customs brokers; stevedoring companies; labor unions; chandlers; warehouses; ship building and repair firms; importers/exporters; pilot associations, etc. Organization (IMO) designated waters off of North American coasts as an Emission Control Area (ECA) where stringent international emission standards will apply for ships. The ECA extends up to 200 nautical miles from the coasts of the United States, Canada and the French Territories. The ECA does not currently extend to U.S. territories or the western coast of Alaska. A separate ECA, the Caribbean ECA, applies to Puerto Rico and the U.S. Virgin Islands.
MaritimeLocated on or near the sea. Commerce or navigation by sea. The maritime industry includes people working for transportation (ship, rail, truck and towboat/barge) companies, freight forwarders and customs brokers; stevedoring companies; labor unions; chandlers; warehouses; ship building and repair firms; importers/exporters; pilot associations, etc. Organization (IMO) designated waters off of North American coasts as an Emission Control Area (ECA) where stringent international emission standards will apply for ships. The ECA extends up to 200 nautical miles from the coasts of the United States, Canada and the French Territories. The ECA does not currently extend to U.S. territories or the western coast of Alaska. A separate ECA, the Caribbean ECA, applies to Puerto Rico and the U.S. Virgin Islands.
The North American ECA is expected to provide significant reductions in PM2.5, NOX, SOX and toxic compounds, both in the near term and the long term. To comply with the ECA, ships will need to significantly reduce their emissions. EPA expects annual emissions from these ships to be reduced as follows:
| Annual Reduction (tons) |
Percent below predicted levels in 2020 without ECA |
|
|---|---|---|
| NOx | 320,000 | 23% |
| PM2.5 | 90,000 | 74% |
| SOX | 920,000 | 86% |
Many non-attainment areas (NAAs) for ozone and PM2.5 are impacted by emissions from ocean-going vessels that call at ports. More than 30 U.S. ports are located in NAAs, and emissions from ships can impact NAAs further inland as well. The map below illustrates projected air quality improvements across the U.S. as result of the North American ECA.
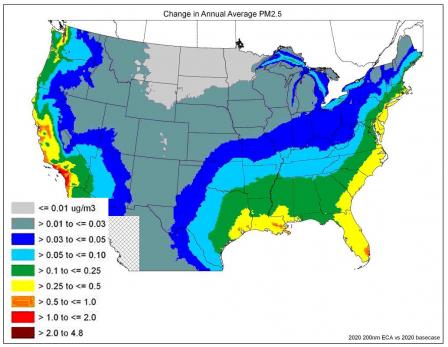 Absolute Improvement in Annual Average PM2.5 Concentrations in 2020 Resulting from the Application of the North American ECA.
Air quality along the U.S. coastline and other areas hundreds of miles inland is expected to improve significantly as a result of the North American ECA. Predicted health benefits by 2020 include prevention of:
- Between 5,000 and 14,000 premature deaths,
- 3,800 emergency room visits, and
- 4.9 million cases of acute respiratory symptoms.
For more information:


