Learn to Use EJSCREEN

EJSCREEN was designed as a web-based tool to provide easy access to reports and maps without the need to install software. To help beginners get started using EJSCREEN, a basic step-by-step walk-through is provided here.
In addition to this page, there are other training materials available on this site. The User Guide is available for download at: User Guide for EJSCREEN (PDF)(49 pp, 2.3 MB, About PDF)
A series of short tutorial videos on the basic EJSCREEN functionality is available on the EJSCREEN Videos page.
The following steps walk through how to start using the tool:
EJSCREEN has a mobile version of the tool that loads when accessing EJSCREEN from mobile phones or tablets. The screen may look slightly different in this mobile version than in the desktop version shown in the User Guide. However, the basic functionality is the same as the desktop version of the tool. For questions on how to use the mobile version of EJSCREEN, please email EPA using the Contact Us page.
The Home Screen
The EJSCREEN Application contains a number of user interface controls as well as data display and advanced analysis tools.
To learn more about EJSCREEN, click the Home link in the top right corner of the tool.

To access help documentation for the EJSCREEN Application, click the Help link in the top right corner of the application.

Along the top bar of the application, a variety of widgets are available for use:
- Report on Selected Place: Pick location and see report on a user-defined place or block group
- Clear Selected Locations: Remove any identified areas from the map
- Map Data: See EJSCREEN and other supplementary map data
- Measure: Measure distance, find the area of a polygon, get lat/long
- Bookmarks: Save locations for review
- Basemap: Change map background to show roads, satellite view, etc.
- Find address or place: Locate a specific address or area
Explore and Navigate
Several ways of displaying maps (basemaps) and navigation tools are available.
Basemaps
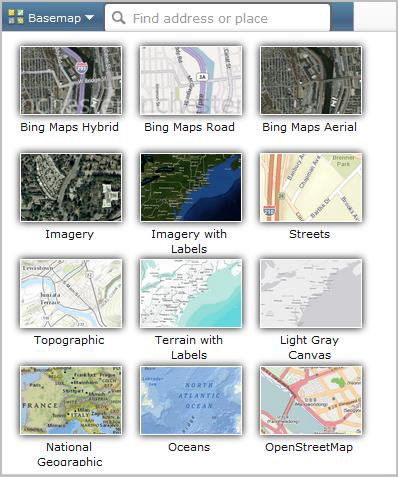
Click the down arrow in the Basemap widget to change the basemap for the map display.
Click any of the basemap options to change the display of the basemap. Bing Maps Road is the default display.
Navigation
The Navigation widget is visible in the upper left hand corner of the application. This widget allows manual navigation of the map display with a click interface.
Zoom In/Out
The map display can be zoomed by using the mouse wheel to zoom in/out, using the Zoom In/Out tool or by bounding box.
To use the Zoom In/Out tool to zoom in and out of the map display:

- Click the plus sign to zoom in to the map display.
- Click the minus sign to zoom out of the map display.
To use a bounding box to zoom in on the map display:
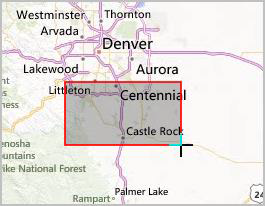
- Hold the shift key with one hand.
- Hold the left mouse button and drag a rectangle to the area of interest.
- Release the mouse button to zoom to selected area.
Pan
The Pan tool is used to scroll the map in the direction and by the amount you choose.
- Click and hold on any location in the map display.
- Drag the mouse and the map will move in the corresponding direction.
Overview Map and Scale Bar
The Overview Map tool displays a small overview map in the lower left-hand corner of the map display that shows a zoomed-out view of the map data along with a gray rectangle that defines the map display's current view extent.
- Click the arrow button to expand the overview map.

- Click the arrow again to minimize the overview map back to its original position.
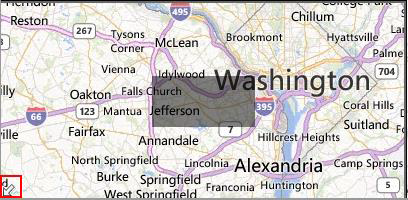
The Scale Bar in the lower left corner of the map display adjusts length according to the zoom level. It is drawn in miles.

Note: The scale bar can be hidden when widgets are open in the EJSCREEN application. You may need to close widgets to view the scale bar.
Search for a Place
Find an Address or Place Widget
The Find an Address widget allows the user to find a location of interest via an address or by coordinates.
Find an Address
In the Find an address or place text box, enter an address or location to search for that location. This can be any of the following:
- a street address
- a town
- a ZIP Code
- other location

The application will list possible matches for the input. Click the search icon, use the enter key on the keyboard or click an entry from the list.
If no matches are found for the input location, the map will remain unchanged.
- Enter a location (for example: street address, town, ZIP Code or other location) in the Enter the address text box.
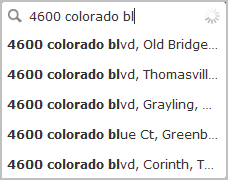
- Click the search icon.
The map display will zoom to that location if found.
Coordinates
Searching by Coordinates allows the user to input longitude and latitude coordinates and zoom to that point.
- Enter values for Longitude (X) and Latitude (Y) in the Find an address or place text box in the longitude, latitude format (e.g. -77.4, 38.8).

- Click the search icon.
The map display will zoom to that location if found.
Note: Currently, EJSCREEN indexes for Puerto Rico and the US territories have not been developed. In addition, PM 2.5 and ozone data currently are not available in EJSCREEN for Alaska and Hawaii.
Bookmarks Widget
Bookmarks List
The Bookmarks widget allows you to bookmark a particular map view so that you can come back to it later in your viewing session or easily switch between views.
- Locate the Widget toolbar at the top of the application.
- Click the Bookmarks icon.

The Bookmarks window will be displayed.

Adding and Deleting Bookmarks
Use the Bookmarks widget to add a new bookmark of the map you are viewing. A name can be provided for this bookmark at the prompt.
- Zoom to a location of interest.
- Click Add Bookmark in the Bookmarks widget.
An Add Bookmark text box will display. - Enter the name of the location of interest in the text box.
- Click outside of the Bookmarks widget when complete to save the bookmark or click the blue X to remove the bookmark.
- To edit a bookmark name click the pencil icon.

- To remove a bookmark, click the Bookmarks button.
- Next to the bookmark created, click the blue X.

The bookmark will be removed.
Please note that the bookmarks are not saved after you exit the EJSCREEN tool.
Report on Known Geography
The Report on Known Geography option allows reporting for a single City, or a single or multiple Counties, Tracts, or Blockgroups.
- Locate the Widget toolbar at the top of the application.
- Click the Generate Reports icon and then the Report on Known Geography link.

The Report on Known Geography window will be displayed.
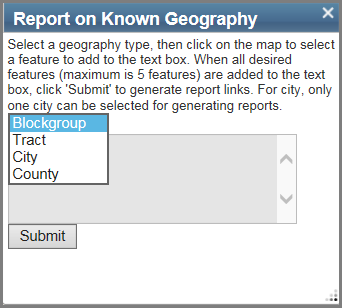
- Select Blockgroup, Tract, City, or County from the Geography Type dropdown menu.
- Then click on the map to add features. Up to five features can be selected for Blockgroup, Tract or County. Only one City can be selected for generating reports.
- Then click ‘Submit’ to generate reports.
Reports
- Report on Selected Place Widget
- Locate an Address
- Buffer
- Explore Reports
- Chart of Data Comparisons
- Tabular View
- Get Printable Standard Report
- Get 2013-2017 ACS Report or 2010 Census Report
Report on Selected Place Widget
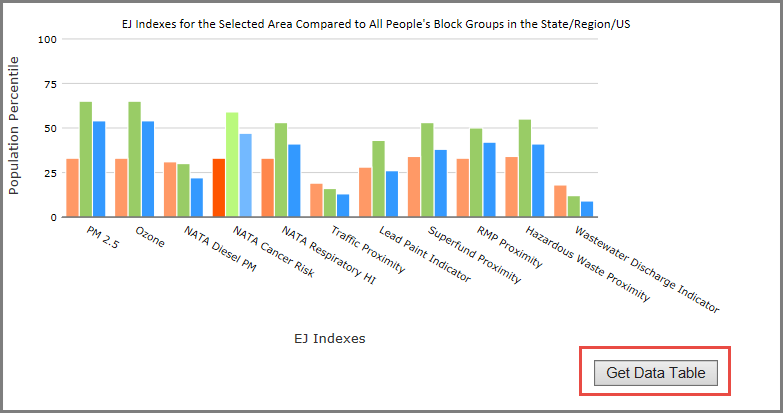
The Report on Selected Place widget is used to identify a location of interest and then provide EJ indexes and environmental and demographic reports for that block group or buffer area. In addition to a bar chart (where scores for the location can be compared to state, regional and national scores), users can generate a tabular view for downloading or a graphic standard report in PDF format.
2012 American Community Survey (ACS), 2010 Census, and 2000 Census reports are also available.
The Report on Selected Place is intended for examining EJ indexes, environmental variables and demographic variables across block group-level data for the United States.
- Locate the Widget toolbar at the top of the application.
- Click the Report on Selected Place icon.

The Report on Selected Place window will be displayed.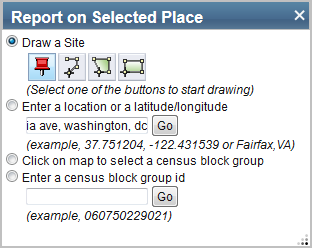
Locate an Address
The Report on Selected Place widget provides options to draw a site, enter a location, or latitude/longitude coordinate pair, click on the map to select a census block group, or enter a census block group ID.
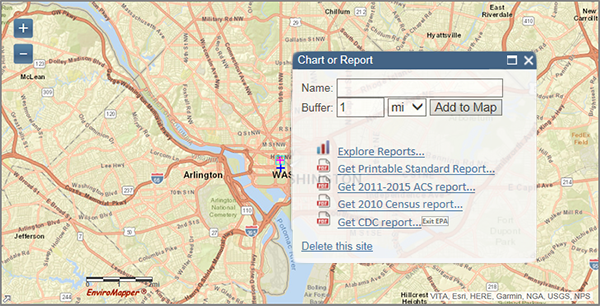
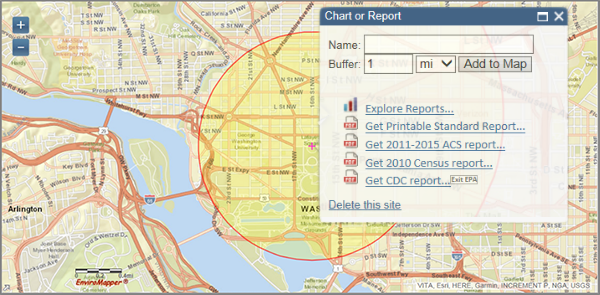
If a point, address, geographic coordinates or a location is selected the map will focus on a point and provide a one-mile buffer as the default.
Whenever a block group is selected, by either clicking on it in the map display or entering it in the widget, the map zooms to that block group to allow the user to examine neighboring groups for variation.
- Type in a location in the Enter a location or a latitude/longitude text box in the Report on Selected Place widget.

- Click Go.
The map display zooms to the location.
Buffer
If you have selected a geographic point, the tool will apply a buffer around that point. The buffer ring will aggregate appropriate portions of the intersecting block groups, weighted by population, to create a representative set of data for the entire ring area, honoring variation and dispersion of the population in the block groups within it. For each indicator, the result is a population-weighted average, which equals the block group indicator values averaged over all residents who are estimated to be inside the buffer.1
The map display will locate the point location and provide the option to add the buffer to the map (for example, one-mile buffer around 1600 Pennsylvania Ave NW, Washington, DC 20004).
1 For buffered areas, values are calculated following these steps:
- The selected point is buffered using the native Geometry Service published through ArcGIS Server.
- To spatially aggregate the EJSCREEN data for the buffered ring area for the analysis, the tool takes into account the block points that exist within the block groups to account for the block groups that are partially intersected with the ring area. A weight factor for each block group is determined by summing each block point population percentage for that block group. If the ring touches part of a neighboring block group that contains no block points, nothing will be aggregated; if a ring intersects a number of block groups, EJSCREEN indices will be aggregated within each block group based on the affiliated block points.
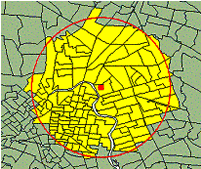
- The aggregation is done by using factor-weighted block points.
These calculated EJSCREEN indices are returned to the web application for display in the viewer (as population and raw values) and for comparison against the percentile tables.
Explore Reports
The Report on Selected Place widget Explore Reports option is driven by 31 data variables, displayed below:


These data variables represent the data that is can be displayed in the bar chart on the bottom half of the widget. As the default, all data layers in the chosen group are selected. Once a data layer is visible, it is displayed in the Chart of Data Comparisons as well as in the Tabular Data table (if currently visible).
Chart of Data Comparisons
Above the main chart in the Report on Selected Place widget, there is a listing of which block group is currently selected for data display along with its state, EPA Region and total population:
This graphic is slightly different for a buffer ring-based analysis, which displays the x,y coordinates of the center of the circle along with radius and aggregate population (estimated):
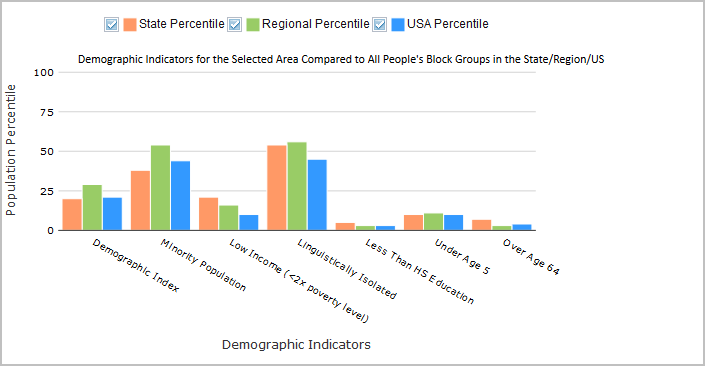
Below the identifying text, there is a series of selection check boxes that allow the user to control which comparative geographies are visible on the chart. The chart is built to handle one geography (state, region or USA) or all three at the same time, so the user may feel free to select whichever comparison is most relevant.
The chart itself displays a series of bar graphs, comparing the currently selected area (either block group or buffered ring) to the state, regional and national statistics for each variable.
The y-axis of the chart runs from 0 to 100 showing percentiles. The x-axis displays different data variables, as selected by the user.
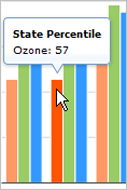
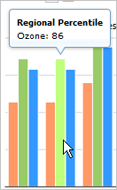
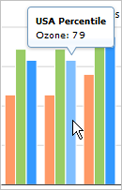
Pointing to a bar will show a pop-up window including the bar's geography, the variable displayed and the percentile that the selected block group or ring represents when compared to a larger group. For example, if your area is at the 57th percentile in the state, this means the average person there has a block group score greater than (or equal to) that of 57% of the state population.
Tabular View
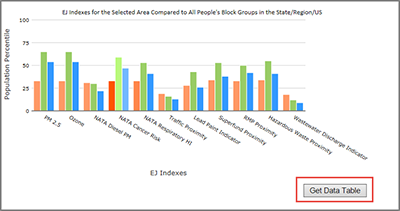
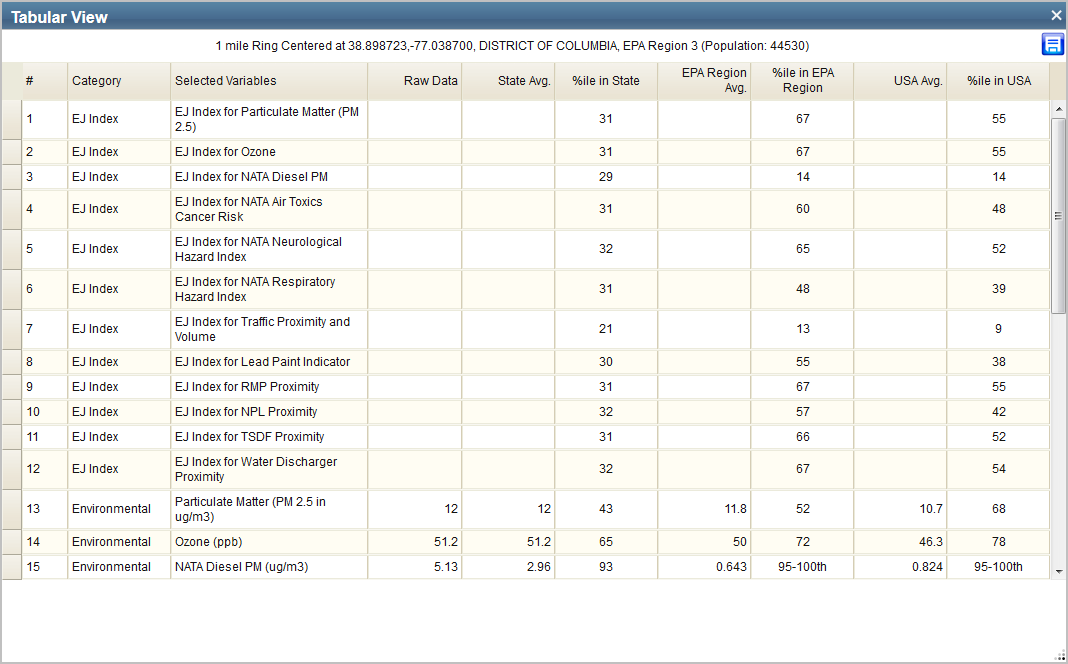
Below the chart data, the Tabular View button takes the displayed data and creates a table in a pop-up window within the application. Whichever variables are selected ("checked") in the data tables are displayed in this table.
EJ indexes do not display raw data, but the rest of the data types include a raw score, state average and percentile, regional average and percentile and national average and percentile.
The user can adjust column widths, scroll through the table, and sort the table by clicking on the column heading. The tabular view also includes the block group Federal Information Processing Standards (FIPS) code, the state, EPA region and population. This table is functional for both the block group selection method and the buffer ring selection method.
In the top right-hand corner of the Tabular View window, there is an icon:  which will allow the user to download data as text file. This functionality will save the tabular data to a comma separated value file at a location of the user's choice. The data can be imported to a spreadsheet program or opened as a text file for archiving or future analysis.
Get Printable Standard Report
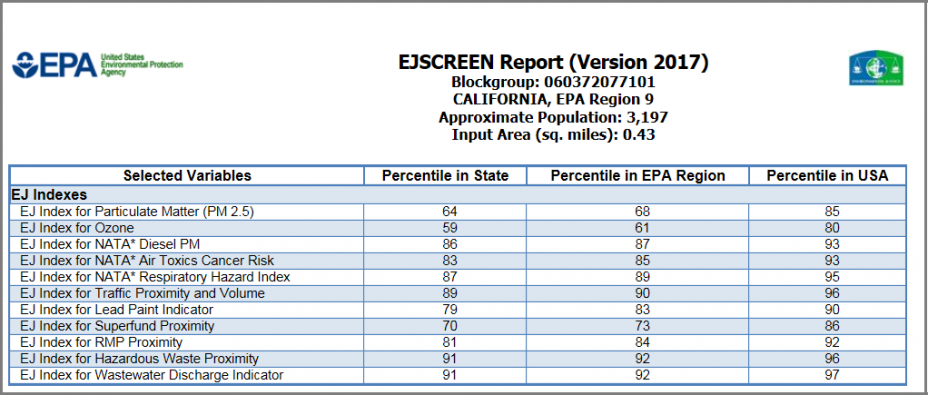
A user who would like a more concrete representation of the data available in EJSCREEN can choose to export a PDF using the Get Printable Standard Report link on the Chart or Report widget.
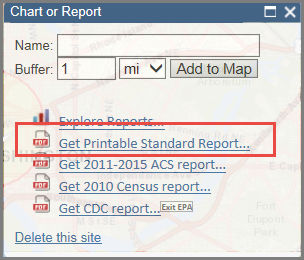
NOTE:It is important to wait for the report to finish creating, which may take 10 seconds or more. Do not click the Get Printable Standard Report link again until a report has been returned.
Once the report is created, the user will then have the option of saving the report as PDF.
- For more details, view the Printable Report Example
The Printable Standard Report report will include the following:
- The current date
- The block group that the data represents (Block group selection)
- The latitude and longitude of the center of the buffered ring (Buffer ring selection)
- The state and EPA region that the data is encompassed by
- Input area (in square miles)
- A table of the number of sites reporting to EPA
- A table of all the variables available in the widget and for each variable the following:
- Raw value (except EJ Indexes)
- State average (except EJ Indexes)
- State percentile
- Regional average (except EJ Indexes)
- Regional percentile
- National average (except EJ Indexes)
- National percentile
- A link to metadata about the report and the tool
Values highlighted in red are above the 95th percentile.
Zero is a known and valid value for a data element. NA (not available or “null”) means that no value was calculated for that data element. For example, Ozone and PM 2.5 concentrations were not available for Alaska, so all associated data elements are set to “null”.
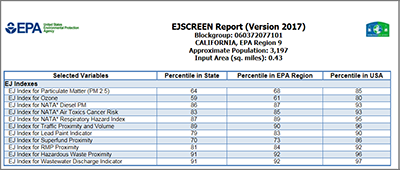
Multiple reports can be created per session.
Get 2013-2017 ACS Report or 2010 Census Report
Two demographic report options are available under the Select Location widget Chart or Report option.
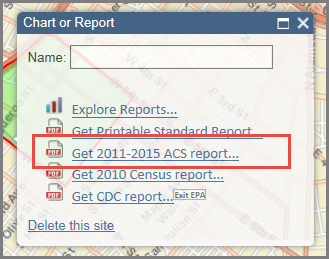
The Get 2013-2017 ACS Report link provides a report with US Census Bureau American Community Survey (ACS) data in PDF format.
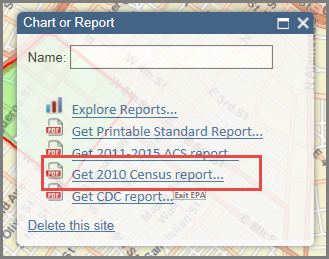
The Get 2010 Census report link provides a report with data from the US Census Bureau, Census 2010 Summary File 1 in PDF format.
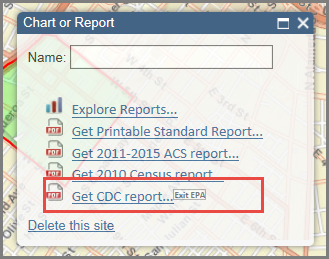
The Get CDC report link links to a Center for Disease Control and Prevention (CDC) report with environmental health issues for the county
Color-coded Maps
Map EJSCREEN Indexes
The EJSCREEN Maps option allows users to display the EJ Indexes, as well as the environmental indicators, and demographic indicators which comprise the EJ Indexes as color-coded (thematic) maps
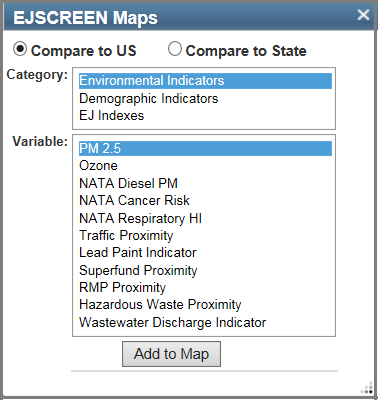
The data available for each of the layer groups are shown below:

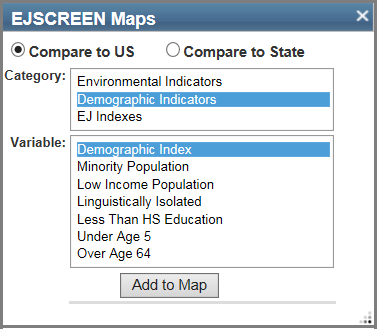
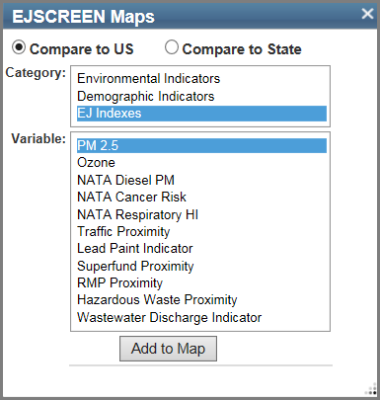
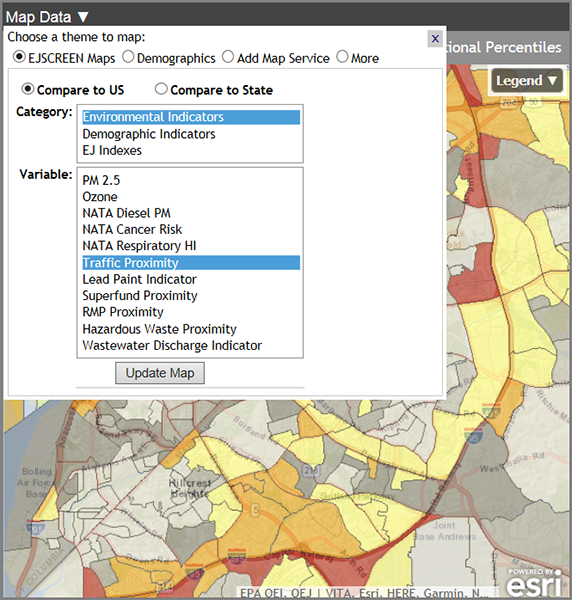
- When the EJSCREEN Maps tool is opened, Compare to US and Environmental Indicators are selected as the default. To change the selections, click the Compare to State radio button if desired, select a Category, then select a Variable from the menu and then click the Add to Map button.
- This will add a map layer that will display the selected variable based on national or state percentile groups as indicated in the legend added under map contents to the right hand side of the map.
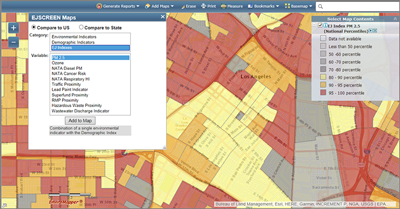
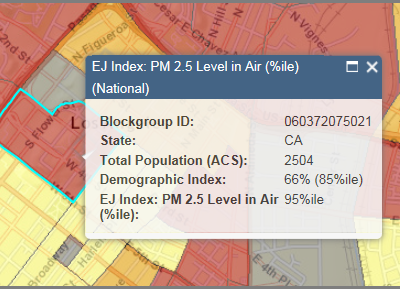
View Larger Image - Clicking on a block group when any of the Map EJ Indexes layers are activated will show a pop-up window that includes the location's blockgroup ID, state, population count, indicator values, and national or state percentile.
Side-by-Side Maps
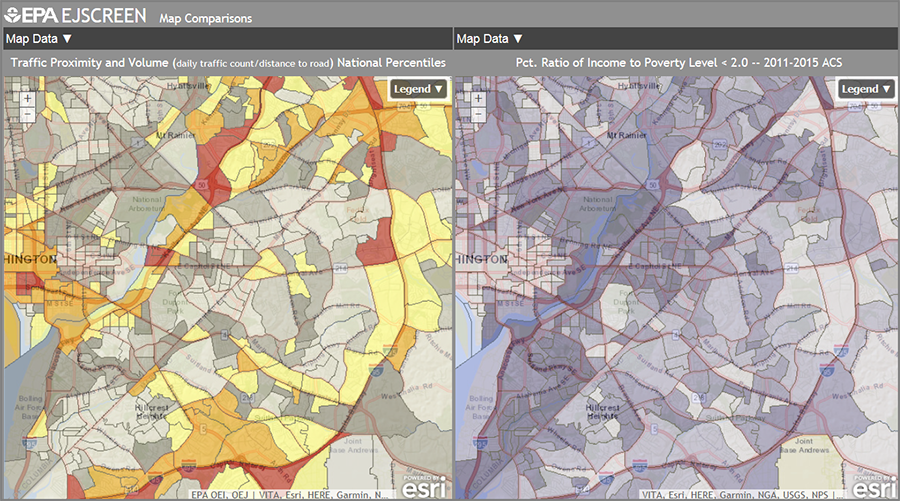
The Side-by-Side Maps option allows users to compare different map layers for a location on side by side maps.
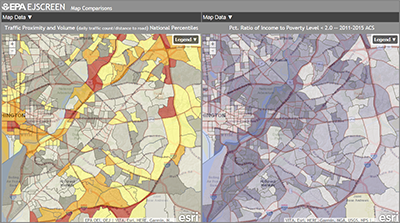
- When the Side-by-Side Maps tool is opened, Traffic Proximity and Volume and Pct Ratio of Income to Poverty Level < 2 are selected as the default map data. To change the selections, click the Map Data button, then select a layer from the menu and then click the Update Map button.This will update the map to display the selected layer.
- To display the Legend click the Legend button in the upper right hand corner of the map.

