Aluminum: Material-Specific Data
The largest source of aluminum in municipal solid waste (MSW) is aluminum cans and other packaging. Aluminum is also found in durable and nondurable goods, such as furniture and appliances.
This web page is a brief summary of aluminum material-specific data. For more comprehensive information, see the 2018 Data Tables on the Advancing Sustainable Materials Management: Facts and Figures Report page.
On this page:
Overview
EPA measures the generation, recycling, composting, combustion with energy recovery and landfilling of aluminum materials.
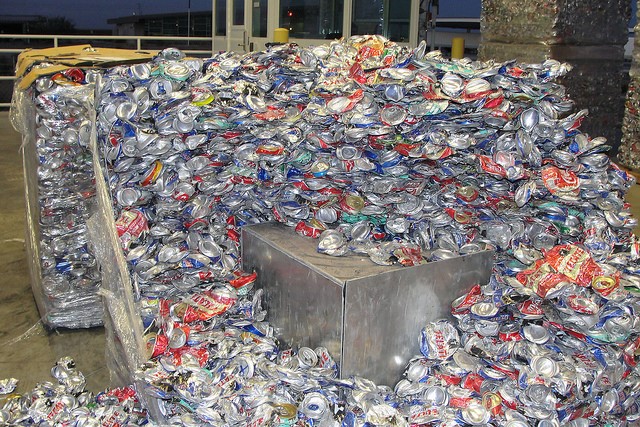 EPA used Aluminum Association industry statistics to estimate aluminum packaging generation. In 2018, aluminum generation was 1.3 percent of total MSW generation at 3.9 million tons. This included 1.9 million tons of aluminum containers and packaging, as well as two million tons found in durable and nondurable goods.
Similar to generation, EPA used industry data from the Aluminum Association to calculate recycling statistics. In 2018, the total recycling rate of aluminum containers and packaging, which includes beverage containers, food containers, foil and other aluminum packaging, was 34.9 percent. Within this number, the most recycled category of aluminum was beer and soft drink cans, at 50.4 percent (0.67 million tons).
The total amount of aluminum combusted in 2018 was roughly 0.6 million tons. This number was 1.6 percent of all MSW combusted with energy recovery in 2018.
In 2018, landfills received approximately 2.7 million tons of aluminum. This was 1.8 percent of all MSW landfilled that year.
Please see the EPA Methodology document for further information on estimating the generation and management of aluminum.
Summary Table and Graph
The data below are from 1960 to 2018, relating to the total number of tons of aluminum generated, recycled, composted, combusted with energy recovery and landfilled.
| Management Pathway | 1960 | 1970 | 1980 | 1990 | 2000 | 2005 | 2010 | 2015 | 2017 | 2018 |
|---|---|---|---|---|---|---|---|---|---|---|
| Generation | 340 | 800 | 1,730 | 2,810 | 3,190 | 3,330 | 3,510 | 3,670 | 3,820 | 3,890 |
| Recycled | - | 10 | 310 | 1,010 | 860 | 690 | 680 | 670 | 600 | 670 |
| Composted | - | - | - | - | - | - | - | - | - | - |
| Combustion with Energy Recovery | - | - | 30 | 300 | 390 | 410 | 440 | 510 | 550 | 560 |
| Landfilled | 340 | 790 | 1,390 | 1,500 | 1,940 | 2,230 | 2,390 | 2,490 | 2,670 | 2,660 |
Source: Aluminum Association data are used for the generation of aluminum packaging and used beverage cans only. Aluminum recycling represents aluminum cans only. Data on the recycling of other aluminum product categories are not available.
A dash in the table means that data is not available.