Rubber and Leather: Material-Specific Data
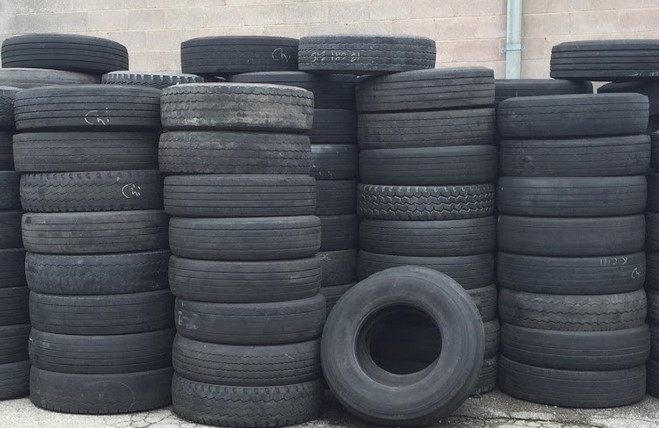
This section discusses rubber and leather in municipal solid waste (MSW). The predominant source of rubber in MSW is rubber tires from automobiles, trucks and motorcycles. Other sources of rubber and leather include clothing and footwear, and other miscellaneous durable and nondurable products. These other sources are quite diverse and include such items as gaskets on appliances, furniture and hot water bottles. EPA only includes tires from passenger cars, trucks and motorcycles, and does not include tires used in equipment, aviation or industrial applications.
Overview
 EPA measures the generation, recycling, composting, combustion with energy recovery and landfilling of rubber and leather materials in MSW.
In 2018, the generation of rubber and leather in MSW was 9.2 million tons in the United States, which was 3.1 percent of total MSW generation.
The only recycling identified for the category of rubber and leather is rubber from tires, which the Agency estimated to be 1.7 million tons in 2018. This number is approximately 40.0 percent of the total amount of rubber in tires generated that year. This recycling estimate does not include retreaded tires or energy recovery from tires. Overall, the recycling rate for rubber and leather in MSW was 18.2 percent in 2018.
The total amount of rubber and leather in MSW combusted in 2018 was 2.5 million tons. This was 7.2 percent of MSW combusted with energy recovery.
Landfills received five million tons of MSW rubber and leather in 2018. This was 3.4 percent of all MSW landfilled.
Please see the EPA Methodology Document for further information on estimating the generation and management of rubber and leather.
Summary Table and Graph
The data below are from 1960 to 2018, relating to the total number of tons of rubber and leather generated, recycled, composted, combusted with energy recovery and landfilled.
| Management Pathway | 1960 | 1970 | 1980 | 1990 | 2000 | 2005 | 2010 | 2015 | 2017 | 2018 |
|---|---|---|---|---|---|---|---|---|---|---|
| Generation | 1,840 | 2,970 | 4,200 | 5,790 | 6,670 | 7,290 | 7,750 | 8,560 | 9,110 | 9,160 |
| Recycled | 330 | 250 | 130 | 370 | 820 | 1,050 | 1,440 | 1,550 | 1,670 | 1,670 |
| Composted | - | - | - | - | - | - | - | - | - | - |
| Combustion with Energy Recovery | - | 10 | 70 | 830 | 1,970 | 2,110 | 1,910 | 2,520 | 2,490 | 2,500 |
| Landfilled | 1,510 | 2,710 | 4,000 | 4,590 | 3,880 | 4,130 | 4,400 | 4,490 | 4,950 | 4,990 |
Sources: U.S. Tire Manufacturers Association, U.S. Department of Commerce International Trade Commission, National Automobile Dealers Association and Modern Tire Dealer Magazine.
A dash in the table means that data is not available.
