Global Greenhouse Gas Emissions Data
On This Page:
Global Emissions by Gas
At the global scale, the key greenhouse gases emitted by human activities are:
 Source: IPCC (2014) Exit based on global emissions from 2010. Details about the sources included in these estimates can be found in the Contribution of Working Group III to the Fifth Assessment Report of the Intergovernmental Panel on Climate Change. Exit
- Carbon dioxide (CO2): Fossil fuel use is the primary source of CO2. CO2 can also be emitted from direct human-induced impacts on forestry and other land use, such as through deforestation, land clearing for agriculture, and degradation of soils. Likewise, land can also remove CO2 from the atmosphere through reforestation, improvement of soils, and other activities.
- Methane (CH4): Agricultural activities, waste management, energy use, and biomass burning all contribute to CH4 emissions.
- Nitrous oxide (N2O): Agricultural activities, such as fertilizer use, are the primary source of N2O emissions. Fossil fuel combustion also generates N2O.
- Fluorinated gases (F-gases): Industrial processes, refrigeration, and the use of a variety of consumer products contribute to emissions of F-gases, which include hydrofluorocarbons (HFCs), perfluorocarbons (PFCs), and sulfur hexafluoride (SF6).
Black carbon is a solid particle or aerosol, not a gas, but it also contributes to warming of the atmosphere. Learn more about black carbon and climate change on our Causes of Climate Change page.
Global Emissions by Economic Sector
Global greenhouse gas emissions can also be broken down by the economic activities that lead to their production.[1]
 Source: IPCC (2014); Exit based on global emissions from 2010. Details about the sources included in these estimates can be found in the Contribution of Working Group III to the Fifth Assessment Report of the Intergovernmental Panel on Climate Change. Exit
- Electricity and Heat Production (25% of 2010 global greenhouse gas emissions): The burning of coal, natural gas, and oil for electricity and heat is the largest single source of global greenhouse gas emissions.
- Industry (21% of 2010 global greenhouse gas emissions): Greenhouse gas emissions from industry primarily involve fossil fuels burned on site at facilities for energy. This sector also includes emissions from chemical, metallurgical, and mineral transformation processes not associated with energy consumption and emissions from waste management activities. (Note: Emissions from industrial electricity use are excluded and are instead covered in the Electricity and Heat Production sector.)
- Agriculture, Forestry, and Other Land Use (24% of 2010 global greenhouse gas emissions): Greenhouse gas emissions from this sector come mostly from agriculture (cultivation of crops and livestock) and deforestation. This estimate does not include the CO2 that ecosystems remove from the atmosphere by sequestering carbon in biomass, dead organic matter, and soils, which offset approximately 20% of emissions from this sector.[2]
- Transportation (14% of 2010 global greenhouse gas emissions): Greenhouse gas emissions from this sector primarily involve fossil fuels burned for road, rail, air, and marine transportation. Almost all (95%) of the world's transportation energy comes from petroleum-based fuels, largely gasoline and diesel.
- Buildings (6% of 2010 global greenhouse gas emissions): Greenhouse gas emissions from this sector arise from onsite energy generation and burning fuels for heat in buildings or cooking in homes. (Note: Emissions from electricity use in buildings are excluded and are instead covered in the Electricity and Heat Production sector.)
- Other Energy (10% of 2010 global greenhouse gas emissions): This source of greenhouse gas emissions refers to all emissions from the Energy sector which are not directly associated with electricity or heat production, such as fuel extraction, refining, processing, and transportation.
Note on emissions sector categories.
Trends in Global Emissions
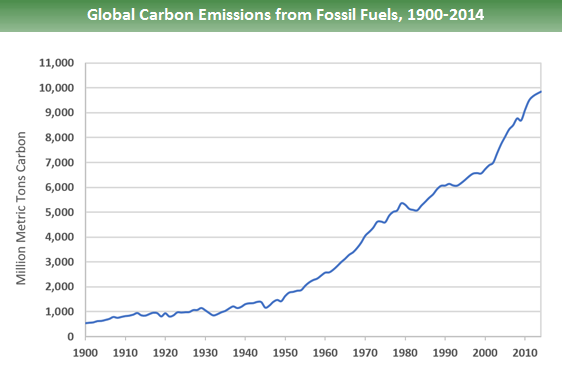 Source: Boden, T.A., Marland, G., and Andres, R.J. (2017). Global, Regional, and National Fossil-Fuel CO2Emissions. Carbon Dioxide Information Analysis Center, Oak Ridge National Laboratory, U.S. Department of Energy, Oak Ridge, Tenn., U.S.A. doi 10.3334/CDIAC/00001_V2017.Global carbon emissions from fossil fuels have significantly increased since 1900. Since 1970, CO2 emissions have increased by about 90%, with emissions from fossil fuel combustion and industrial processes contributing about 78% of the total greenhouse gas emissions increase from 1970 to 2011. Agriculture, deforestation, and other land-use changes have been the second-largest contributors.[1]
Emissions of non-CO2 greenhouse gases have also increased significantly since 1900. To learn more about past and projected global emissions of non-CO2 gases, please see the EPA report, Global Anthropogenic Non-CO2 Greenhouse Gas Emissions: 1990-2020.
Emissions by Country
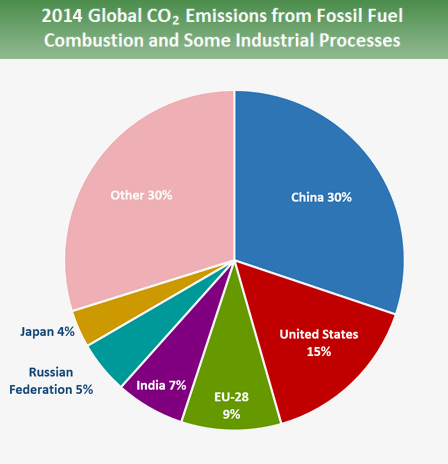 Source: Boden, T.A., Marland, G., and Andres, R.J. (2017). National CO2 Emissions from Fossil-Fuel Burning, Cement Manufacture, and Gas Flaring: 1751-2014, Carbon Dioxide Information Analysis Center, Oak Ridge National Laboratory, U.S. Department of Energy, doi 10.3334/CDIAC/00001_V2017.In 2014, the top carbon dioxide (CO2) emitters were China, the United States, the European Union, India, the Russian Federation, and Japan. These data include CO2 emissions from fossil fuel combustion, as well as cement manufacturing and gas flaring. Together, these sources represent a large proportion of total global CO2 emissions.
Emissions and sinks related to changes in land use are not included in these estimates. However, changes in land use can be important: estimates indicate that net global greenhouse gas emissions from agriculture, forestry, and other land use were over 8 billion metric tons of CO2 equivalent,[2] or about 24% of total global greenhouse gas emissions.[3] In areas such as the United States and Europe, changes in land use associated with human activities have the net effect of absorbing CO2, partially offsetting the emissions from deforestation in other regions.
References
1. IPCC (2014). Climate Change 2014: Mitigation of Climate Change. Exit Contribution of Working Group III to the Fifth Assessment Report of the Intergovernmental Panel on Climate Change [Edenhofer, O., R. Pichs-Madruga, Y. Sokona, E. Farahani, S. Kadner, K. Seyboth, A. Adler, I. Baum, S. Brunner, P. Eickemeier, B. Kriemann, J. Savolainen, S. Schlömer, C. von Stechow, T. Zwickel and J.C. Minx (eds.)]. Cambridge University Press, Cambridge, United Kingdom and New York, NY, USA.
2. FAO (2014). Agriculture, Forestry and Other Land Use Emissions by Sources and Removals by Sinks (PDF). (89 pp, 3.5 MB) Exit Climate, Energy and Tenure Division, FAO.
3. IPCC (2014): Climate Change 2014: Synthesis Report. Contribution of Working Groups I, II and III to the Fifth Assessment Report of the Intergovernmental Panel on Climate Change. Exit [Core Writing Team, R.K. Pachauri and L.A. Meyer (eds.)]. IPCC, Geneva, Switzerland, 151 pp.