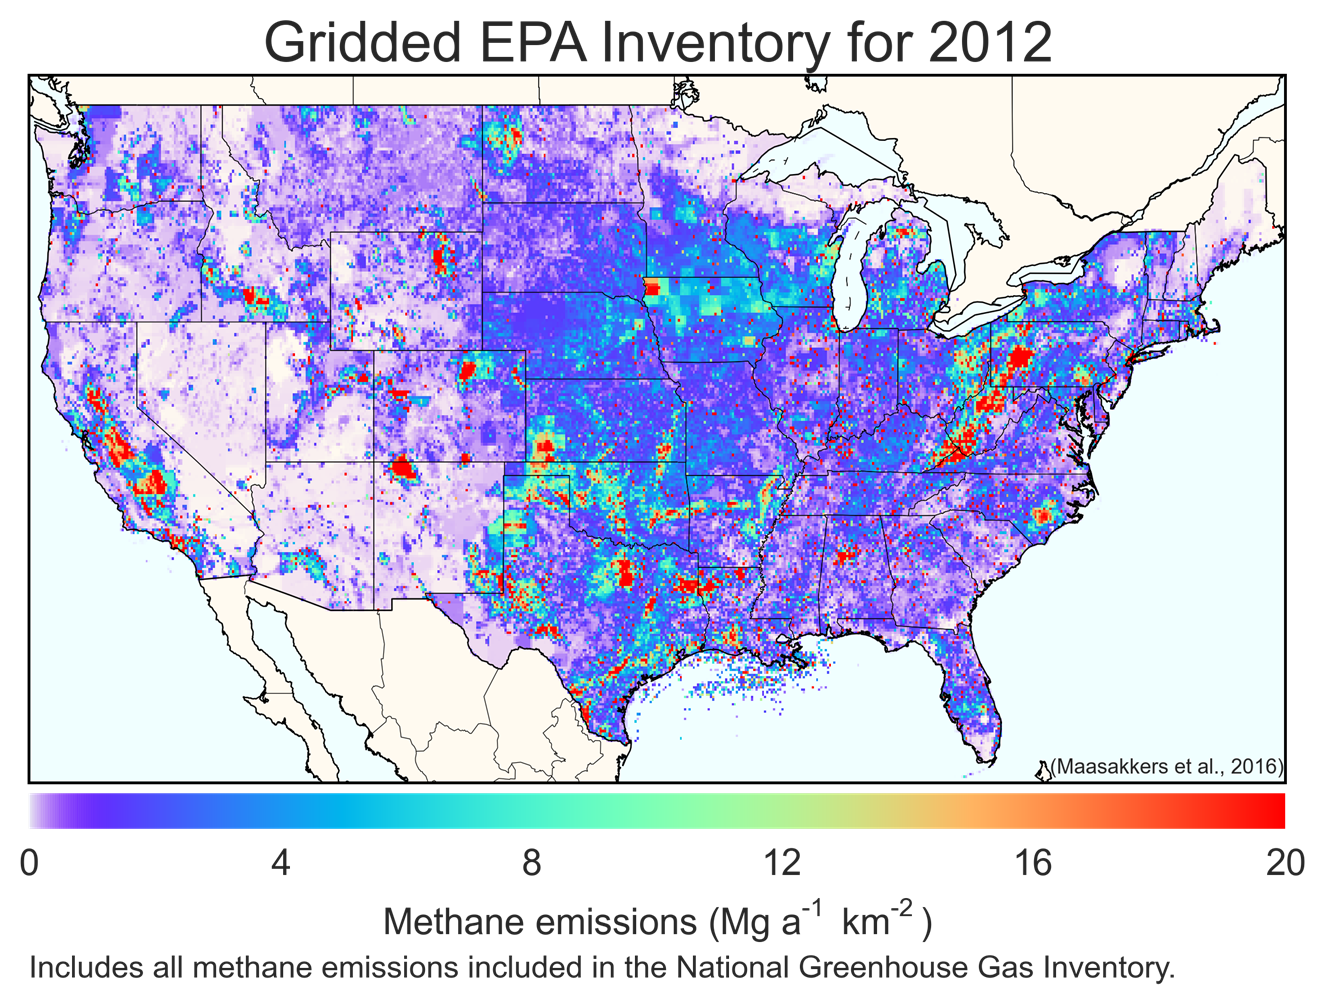
Gridded 2012 Methane Emissions
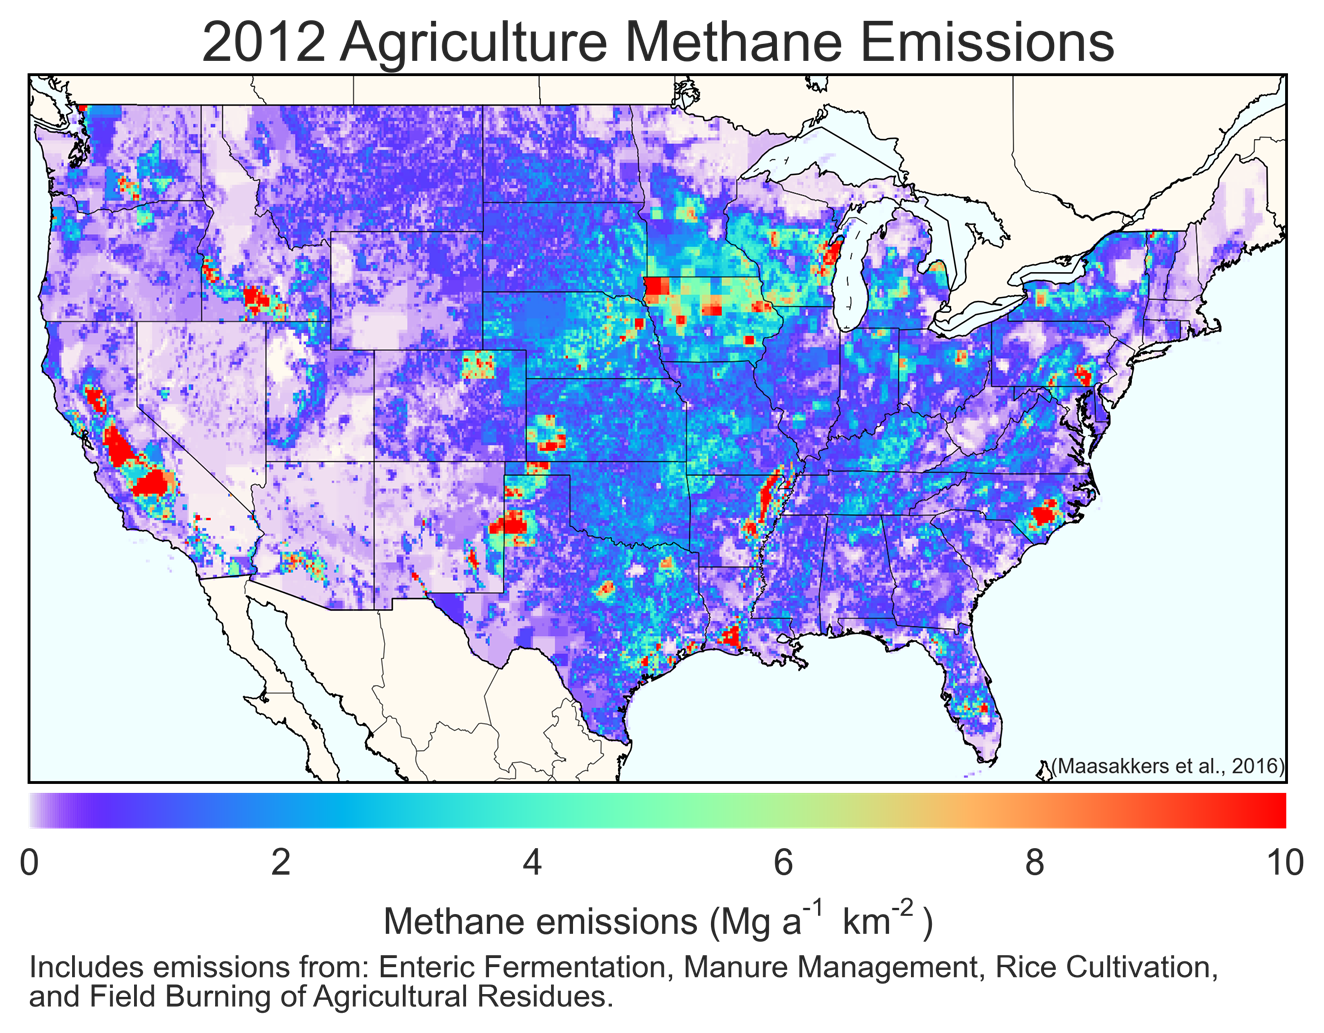
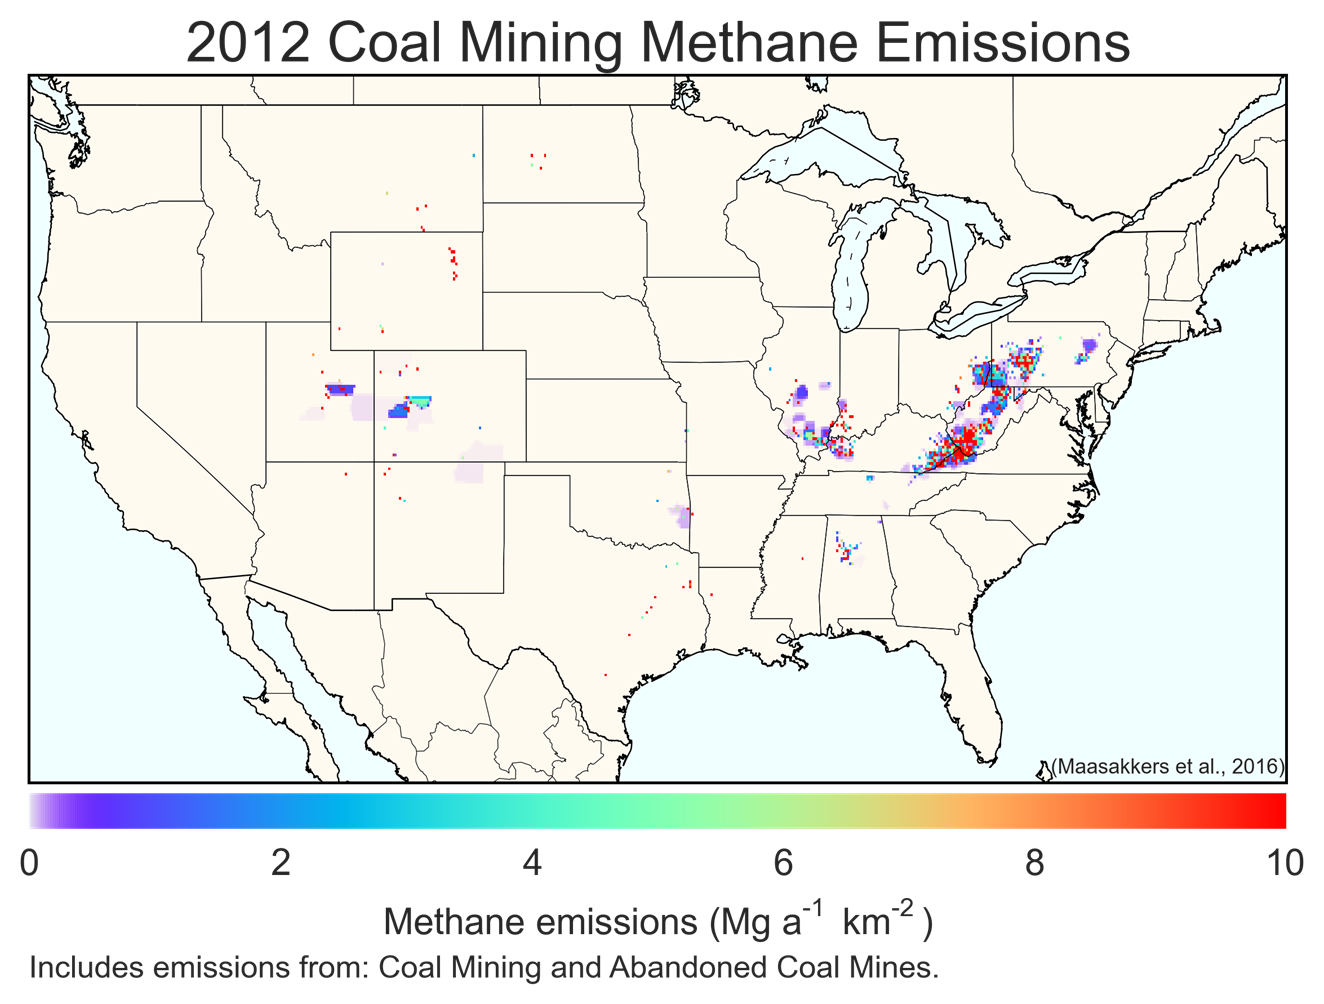
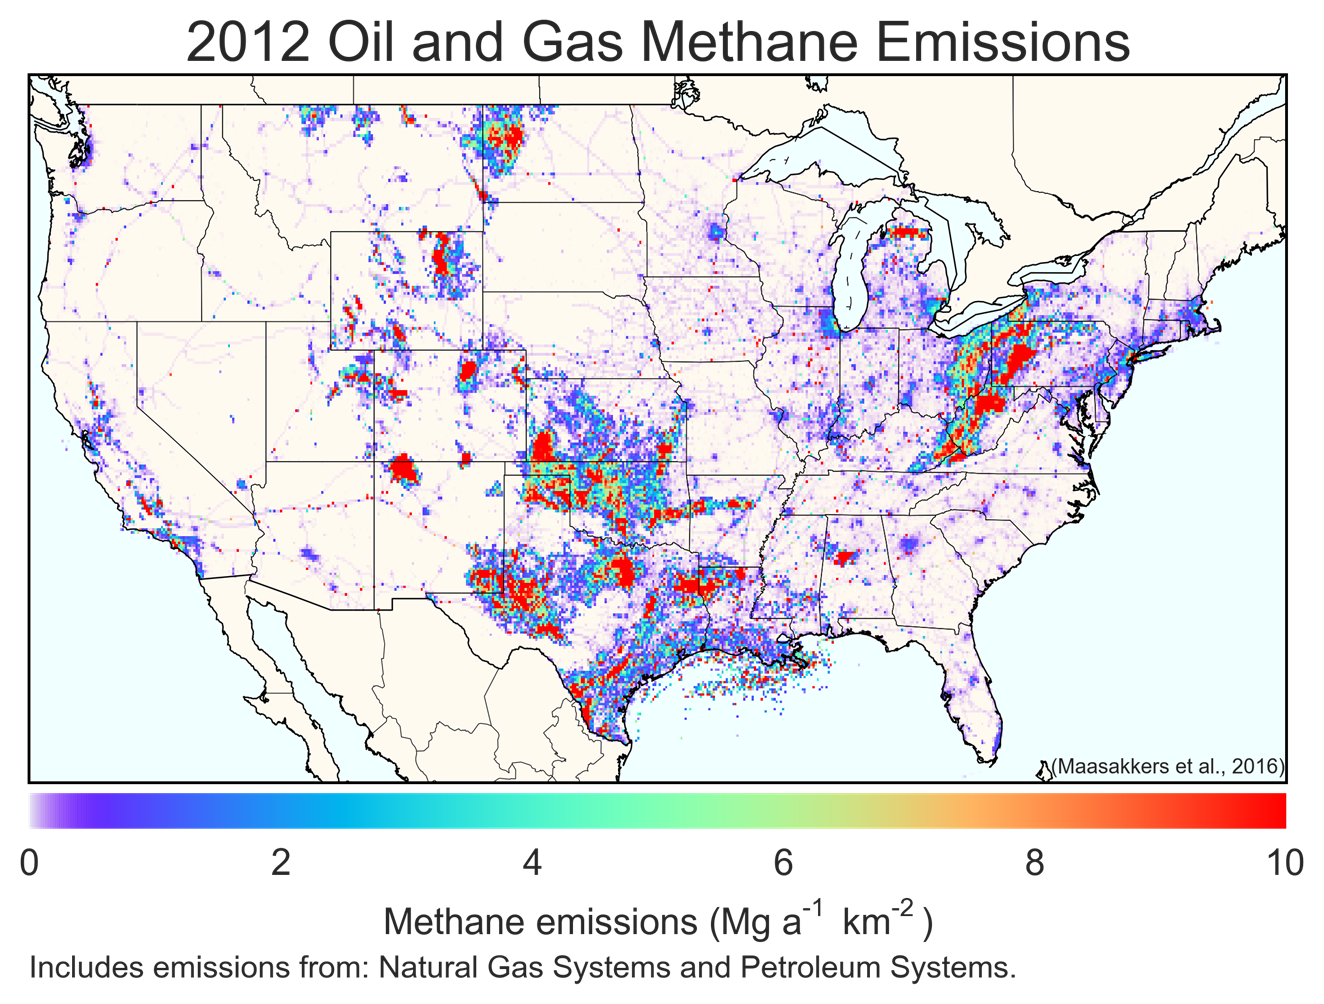
A team at Harvard University along with EPA and other coauthors developed a gridded inventory of U.S. anthropogenic methane emissions with 0.1° x 0.1° spatial resolution, monthly temporal resolution, and detailed scale-dependent error characterization. The inventory is designed to be consistent with the 2016 U.S. EPA Inventory of U.S. Greenhouse Gas Emissions and Sinks estimates for the year 2012, which presents national totals for different source types. The gridded inventory was developed using a wide range of databases at the state, county, local, and point source level to allocate the spatial and temporal distribution of emissions for individual source types.
This data can be used by researchers to better compare the national-level inventory with measurement results that may be at other scales. Users of this gridded inventory are asked to cite the original reference (Maasakkers et al., 2016) in their publications. Error estimates are given in that reference.
- Paper: Maasakkers et. al. 2016, A Gridded National Inventory of U.S. Methane Emissions
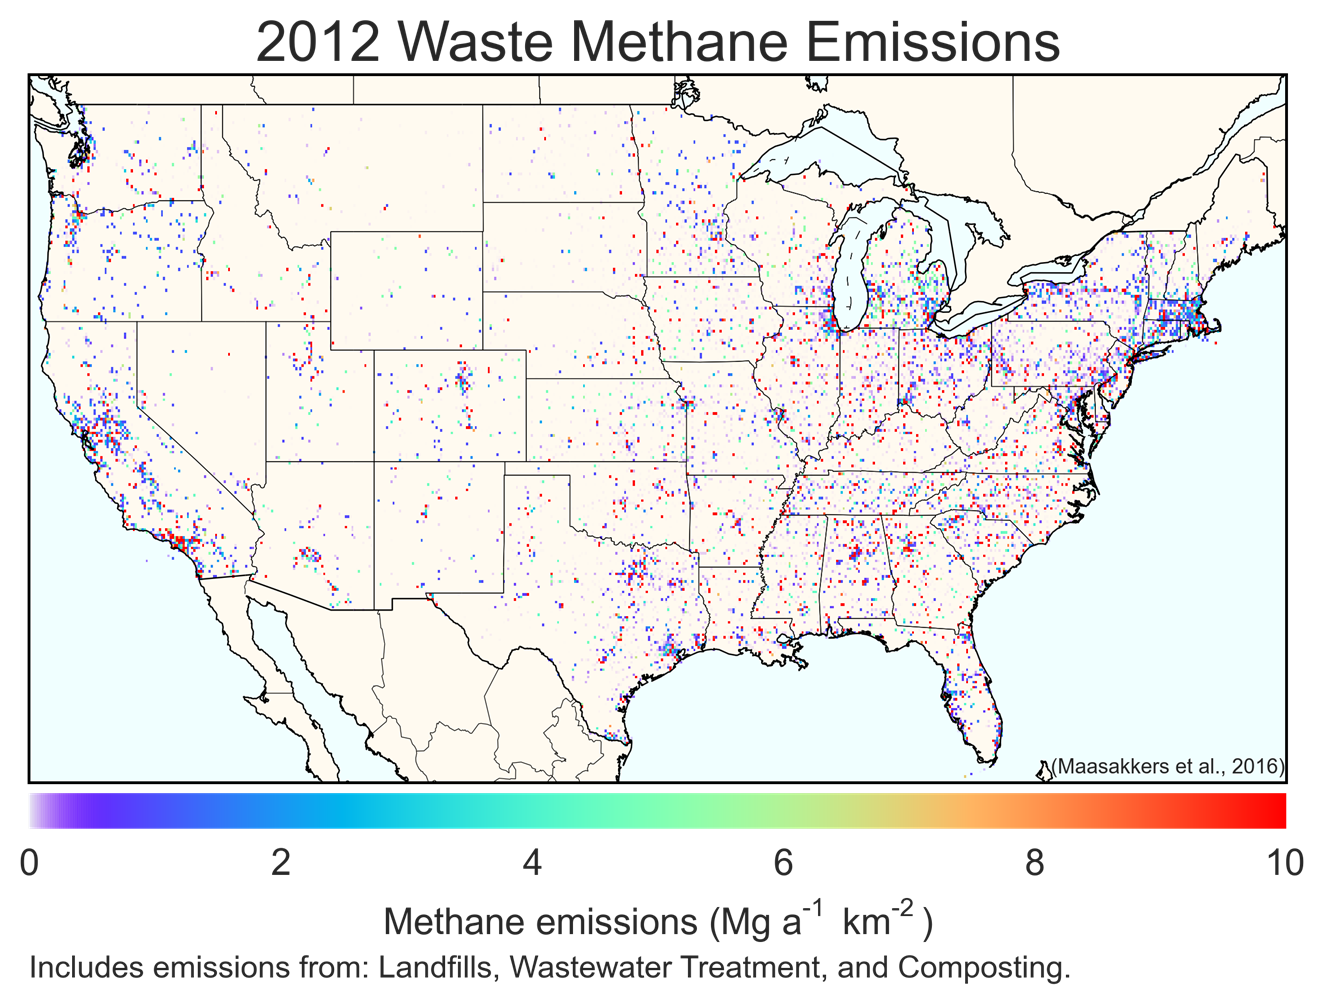
- Maps based on the gridded 2012 methane data
- Data
Paper: Maasakkers et. al. 2016, A Gridded National Inventory of U.S. Methane Emissions
Maps based on the gridded 2012 methane data
Data
Gridded 2012 Methane Data(3 pp, 13 MB) : This ZIP file contains .nc files with daily, monthly, and annual data.