Capture, Supply, and Underground Injection of Carbon Dioxide
EPA's Greenhouse Gas Reporting Program (GHGRP) collects key information regarding the capture, supply, and underground injection of carbon dioxide (CO2) in the United States. Greenhouse gas (GHG) data from these activities are reported under the following GHGRP subparts:
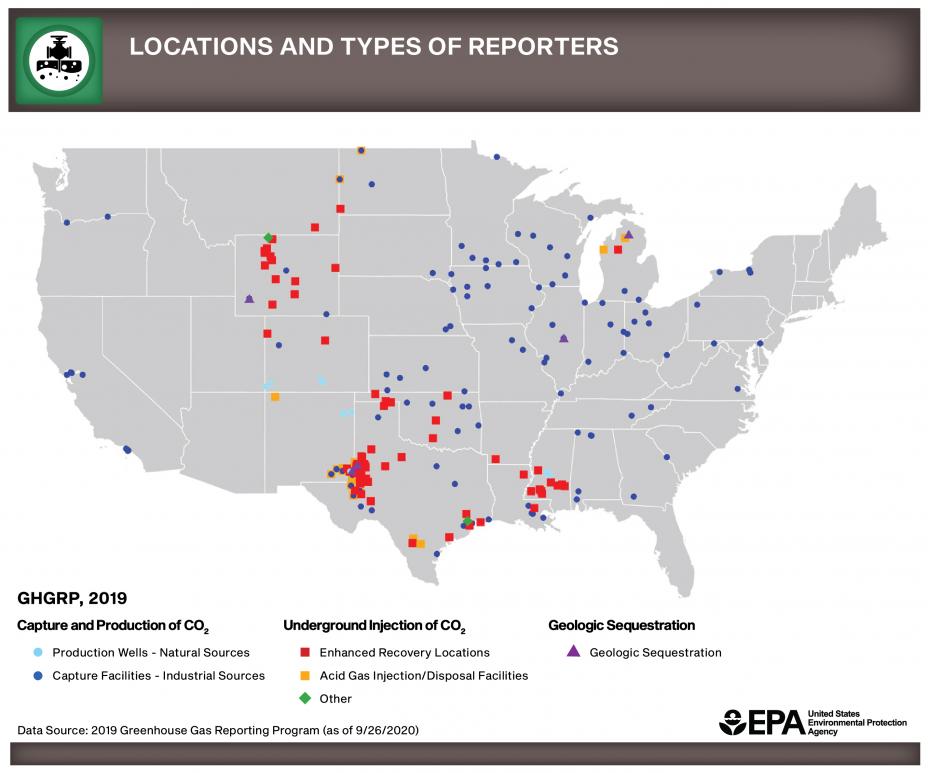
- Suppliers of CO2 (subpart PP) covers facilities that capture CO2 from industrial sources and processes or extract it from natural CO2-bearing formations for supply into the economy.
- Underground injection of CO2 (subpart UU) covers facilities that inject CO2 underground for enhanced oil and gas recovery (ER), acid gas injection/disposal, carbon storage research and development (R&D), or for any other purpose other than geologic sequestration.
- Geologic sequestration of CO2 (subpart RR) provides a mechanism for facilities to monitor and report to EPA amounts of CO2 sequestered. Facilities submit a plan for monitoring, reporting and verifying CO2 sequestered underground. Once the plan is approved, facilities report basic information on CO2 received for injection, data related to the amounts of CO2 sequestered, and annual monitoring activities. EPA approved the first "monitoring, reporting, and verification" plan in December 2015 and data were reported beginning with the 2016 reporting year.
| GHGRP, 2019* | ||
|---|---|---|
| Capture and Supply of CO2** | Amount (MMT***) | Reporting Facilities |
| Total CO2 captured and produced | 61.3 | 122 |
| CO2 captured (industrial sources) | 22.3 | 110 |
| CO2 produced (natural sources) | 39.0 | 12 |
| Underground Injection of CO2 | Amount (MMT***) | Reporting Facilities |
| Total CO2 received for underground injection | 49.3 | 93 |
| CO2 received for enhanced oil and gas recovery | 48.7 | 64 |
| CO2 received for acid gas injection/disposal, carbon storage R&D, and other purposes | 0.6 | 29 |
| * As of 9/26/2020 ** The GHGRP also collects data from importers and exporters of carbon dioxide. These data are not provided in the table but these reporters can be identified through FLIGHT. *** Million Metric Tons |
||
Capture and Supply of CO2
Ethanol, natural gas, and ammonia production are among the top three industrial facility types that capture CO2 for supply into the economy.
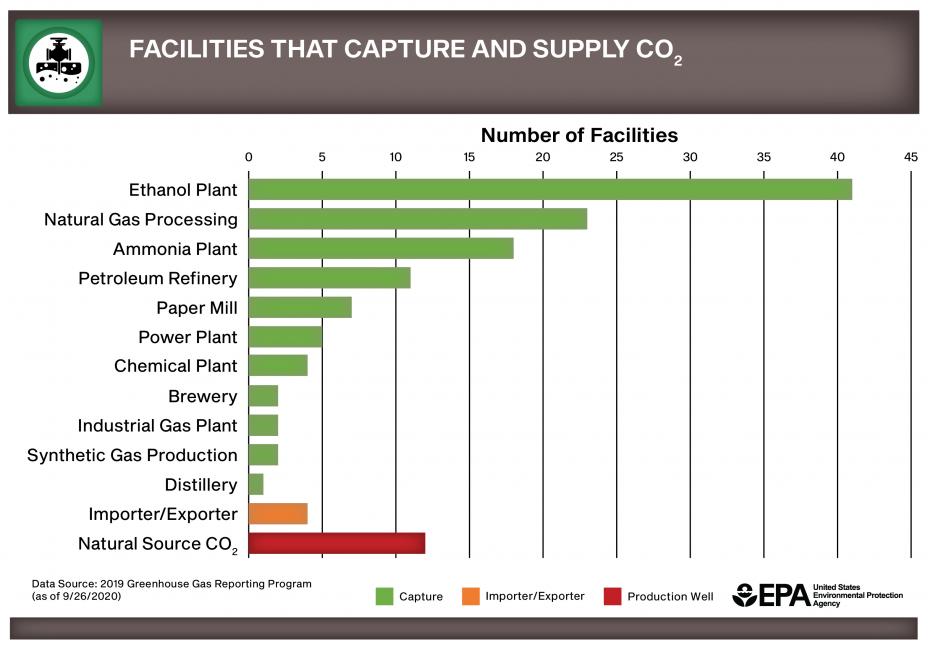
In 20191, most of the CO2 captured from industrial processes (66 percent) and nearly all of the CO2 produced from natural sources (96 percent) was used for ER. Food and beverage manufacturing is the second most common end use, followed by other end uses such as pulp and paper manufacturing, fire-fighting equipment, and metal fabrication.
1 As of 9/26/2020.

* Includes cleaning and solvent use, fumigants and herbicides, transportation and storage of explosives, fire-fighting equipment, industrial and municipal water/wastewater treatment, pulp and paper, metal fabrication, greenhouse plant growth, long term storage, and unknown (which may include ER).
** Note that some CO2 suppliers reported the primary end use for captured or produced CO2 as "unknown." It is believed that the quantities reported by CO2 suppliers as "unknown" account for the difference between CO2 received for ER and CO2 supplied for ER.
Underground Injection of CO2
After CO2 is captured or produced, it can be compressed and transported to a site where it is injected underground. Some facilities both capture or produce CO2 and inject it underground onsite.
The primary use of carbon dioxide is for ER. ER helps to mobilize oil and gas in underground hydrocarbon reservoirs, thereby increasing production. While most CO2 captured or produced is supplied to facilities that conduct ER, a smaller portion is injected underground for other purposes.