Greenhouse Gas Reporting Program and the U.S. Inventory of Greenhouse Gas Emissions and Sinks
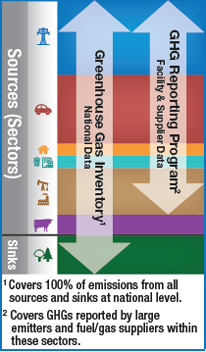
Many industries and activities, large and small, emit greenhouse gases in the United States. These sources are found across all segments of the U.S. economy. EPA is responsible for characterizing greenhouse gas emissions using two complementary programs designed to help the public and policymakers understand both the sources and magnitude of these emissions.
The Inventory of U.S. Greenhouse Gas Emissions and Sinks (Inventory) is a document prepared annually by EPA, for over 25 years, that estimates the total greenhouse gas emissions across all sectors of the economy using national-level data.
The Greenhouse Gas Reporting Program (GHGRP) collects detailed emissions data from the largest greenhouse gas emitting facilities in the U.S. The GHGRP has collected data annually since 2010.
While the Inventory provides high level perspective needed to understand the United States’ total emissions or “carbon footprint,” the GHGRP provides the detailed information that helps us better understand the sources and types of greenhouse gas emissions at individual facilities. The GHGRP data set is an important resource for developing the Inventory, providing annual emissions information and other annual information, such as activity data and emissions factors, that can improve and refine national emission estimates and trends over time.
GHGRP information can also help industry identify opportunities for reduction and help communities identify nearby sources of greenhouse gas emissions. These data can be used to compare facilities or industries, track emissions from one year to the next, inform policy at the state and local levels, and provide important information to the finance and investment communities.
You can use the data from these two programs to answer common questions about U.S. greenhouse gas emissions. For example, the Inventory could help you find the contribution of the transportation sector, or the power sector, to total U.S. greenhouse gas emissions. The GHGRP could help you find the biggest stationary sources of greenhouse gas emissions in your region.
| Inventory of U.S. Greenhouse Gas Emissions and Sinks | Greenhouse Gas Reporting Program | |
|---|---|---|
| Find total U.S. emissions | ||
| Review trend data for the past 25 years | ||
| Browse a map to find largest emitters in your area | ||
| Compare facility emissions across an industrial sector | ||
| Find reported emissions by state |
Percent of U.S. Emissions Covered
The Inventory estimates the total greenhouse gas emissions across all sectors of the economy using national-level data such as fuel use. This includes estimates of greenhouse gas emissions from fossil fuel combustion, various industrial processes, and agricultural sources. The comprehensive greenhouse gas data presented in the Inventory comprise the official U.S. estimate of total national emissions that is submitted to the United Nations in accordance with the Framework Convention on Climate Change.
The GHGRP includes most, but not all, U.S. emissions. In general only large suppliers of greenhouse gas emitting products, or facilities that emit more than 25,000 metric tons of CO2 equivalent (CO2e) per year (roughly equivalent to the CO2 emitted from the burning of 136 rail cars of coal), are required to report their annual greenhouse gas emissions. Some entire sectors, such as the agricultural and land-use sectors, are not required to report. Over 8,000 facilities and suppliers reported greenhouse gas data to EPA for 2019, covering approximately 85-90% of total U.S. greenhouse gas emissions.
Years of Data Available
The Inventory presents national greenhouse gas emissions estimates from 1990 and each subsequent year. Through the Inventory, EPA now has trend data for national greenhouse gas emissions for over 25 years.
The GHGRP is a more recent program, developed in response to Congressional mandate from 2008, so there are fewer years of data available. Annual GHG data for covered facilities in 29 industry types is available starting in 2010. Annual GHG data for covered facilities in an additional 12 industry types is available starting in 2011.
Geographic Information
Because the Inventory uses aggregate national data (such as fuel use) to estimate greenhouse gas emissions for most sources, it generally does not provide geographic information showing the location of the emissions.
In contrast, since the GHGRP data is collected from facilities, it is possible to map source location and aggregate reported emissions by county, state, or region, for industries who report direct emissions. The GHGRP’s online Facility Level Information on GreenHouse gases Tool (FLIGHT) allows users to locate large emitters in their communities or state, and to view emissions by industry type or greenhouse gas.
Facility Map
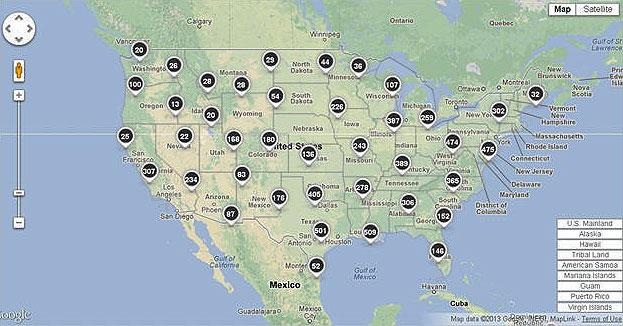 This sample screenshot, showing the number of facilities in each geographic region, is an example of one of the many views that can be created through, FLIGHT, the online data publication tool.
Industry-Specific Information
A large amount of greenhouse gas emissions in the industrial sector come from the burning of fossil fuels for energy. The Inventory has a comprehensive estimate of these emissions, but because it is based on aggregate national data for fuel use, the Inventory cannot show relative emissions from specific industries within the industrial sector. Likewise, the Inventory cannot show the largest emitting facilities within a specific industry.
The GHGRP data provides EPA with an opportunity to use facility-specific information to disaggregate the national estimate for emissions from fossil fuel combustion to specific industries such as refineries, metals production, and chemical manufacturing. In addition, it allows for comparison of emissions between facilities within the same industry. These data can be an important tool for businesses and other innovators to find cost- and fuel-saving efficiencies that reduce greenhouse gas emissions.
For a more detailed comparison of Inventory and GHGRP emissions data for the industrial sector, please see the fact sheet GHG Emissions by Industry – GHGRP vs. U.S. GHG Inventory.