Green Power Pricing
Prices of green power can vary for your organization depending on a variety of factors, including:
- Supply and demand variability
- Product type (e.g., renewable energy certificates [RECs], utility green power products, competitive green power products, power purchase agreements [PPAs], self-supply)
- Volume of purchase (e.g., total kilowatt-hours)
- Term of commitment (e.g., short- or long-term)
- Resource and technology type (e.g., solar, wind, biomass)
- Geography (e.g., local versus national)
- Age of renewable energy project and generation dates
- Certification/verification status
EPA recommends seeking multiple price estimates from suppliers to assess the market rate for green power products that meet your organization's unique goals. In the below sections, we review pricing information by green power product category. These pricing figures and information should be viewed as illustrative since prices and markets often change over time.
The green power pricing examples we are highlighting here include:
- Renewable Energy Certificates (RECs)
- Utility and Competitive Electricity Supplier Green Power Products
- Power Purchase Agreements (PPAs)
- Self-Supplied Solar
Because the product categories listed below represent different ways of procuring green power, it is difficult to directly compare the prices between products since some product categories include the price for electricity plus RECs, while others only include the price premium relative to a standard electricity offer, while still others represent only the price of the RECs but not the electricity, and some are based on wholesale prices, which typically are not available to retail customers. For example, PPAs may include both the RECs and the electricity from specific green power generators, whereas retail RECs do not include the underlying electricity.
Renewable Energy Certificates
Retail renewable energy certificates (RECs) refers to RECs that are sold, delivered, or purchased separately from electricity (commonly referred to as “unbundled”). They represent proof of renewable electricity delivered to the grid and represent the environmental effect of that renewable electricity to reduce the average grid emissions near the project that produced the RECs. A retail REC purchase provides no physical delivery of electricity to customers. The customer is purchasing its physical power from a separate entity than the one selling them the RECs. RECs are a marketable commodity that can be used for both by utilities and energy providers for compliance purposes and residential and non-residential consumers for voluntary purposes.
Many states require utilities and other electric service providers to either generate green power themselves or purchase RECs that are used to meet the specific compliance requirements, such as state Renewable Portfolio Standards (RPS). The wholesale market price for RECs that are eligible to meet state RPS compliance requirements tend to be relatively expensive when compared to RECs that are ineligible due to resource type or geography. Pricing is ultimately driven by supply and demand, and state RPS policies most often create markets for eligible RECs with established procurement levels, timetables, geographic boundaries, and penalize non-compliance. These factors result in higher wholesale market prices for RECs that are eligible to be used for compliance claims by regulated entities.
RECs can also be purchased by consumers for voluntary purposes which enables them to exclusively use renewables beyond what would have otherwise occurred as a result of regulation or mandate. RECs used for voluntary purposes tend to be less expensive since buyers are able to draw from a larger national supply of RECs. Please note that retail customers pay retail prices; however, retail prices can be discounted when purchasing large volumes and/or making longer term commitments.
Learn more about how voluntary and mandatory markets impact wholesale REC pricing.
 Figure 1: Price of RECs used in compliance market (exclusing SRECs) January 2012 - August 2018 - https://www.nrel.gov/docs/fy19osti/72204.pdfExit
As illustrated in Figure 1, wholesale prices for compliance-eligible RECs (excluding solar RECs) vary greatly by state and through time depending on that state’s specific policies and supply and demand dynamics. Compliance-eligible RECs (excluding solar RECs) have reached $60 per megawatt-hour (MWh) in some states in the last few years. In states with solar carve-out policies, which are special requirements of RPSs that mandate utilities procure solar RECs (SRECs) produced in state or pay an alternative compliance fee, wholesale prices for solar RECs are generally higher than other compliance-eligible RECs in that state, as depicted in Figure 2.
 Figure 2: SREC Pricing - January 2012 - August 2018 https://www.nrel.gov/docs/fy19osti/72204.pdfExit
New Jersey serves as a good example as to how state policies and policy design can impact the dynamics of compliance-eligible REC prices. In late 2011 solar installations in New Jersey surpassed the state-mandated goal of 370 MW for the Energy Year 2012 (June 1, 2011 through May 31, 2012). Once the goal was reached, demand from energy suppliers weakened, leading to an oversupply of REC. This caused the wholesale prices to decline steeply in late 2011 from about $600/MWh to $200/MWh.1
 Figure 3: Voluntary national REC prices - January 2012 - August 2018 - https://www.nrel.gov/docs/fy19osti/72204.pdf Exit
Voluntary wholesale REC prices, as depicted in Figure 3, have been on a fairly steady decline in the last several years, from $1.2/MWh in 2010 to less than $0.35/MWh in 20162. Factors such as the geographic location, technology, generation date, certification, and competition with compliance-eligible RECs can also influence the price of these voluntary RECs. Most retail RECs come from wind projects, with over half coming from those in Kansas, Oklahoma, and Texas alone in 20152.
Retail RECs are a low price, yet cost-premium green power option for consumers. Purchases are simple to execute, offer low transaction costs to serve complex operational footprints, and can be tailored in many ways to meet specific consumer requirements (i.e., resource, term of commitment, geography, vintage etc.). Because of these factors, retail REC purchases have, and continue to, dominate the voluntary green power market. NREL reports that retail RECs made up more than 54 percent of voluntary green power sales in 20152, while about 68 percent of the green power used by Green Power Partners was in the form of retail RECs in that year.
Utility and Competitive Electricity Supplier Green Power Products
Many consumers gain access to renewable electricity through their electricity supplier. Depending on where they are located, the supplier may be in a traditionally regulated market, meaning that the vertically-integrated utility is responsible for the entire flow of electricity (from generation to delivery) to consumers. Or, consumers may be in a competitive retail electricity market, where the market uses competitive market mechanisms which allow independent power producers and non-utility generators to trade power, thereby providing the consumers with an array of choices to access renewable electricity.
In both of these cases, the utility supplied green power products bundle the renewable energy certificates with the electricity for the customer. In some cases, the utility may be buying retail RECs to supply their green pricing program or they may be coming from utility-owned renewable energy projects.
Utility green power products are an optional utility service that allows customers in traditionally regulated markets to procure bundled renewable electricity. Since these vertically-integrated utilities own the generation, transmission and distribution systems used to serve electricity consumers, the consumers can get access to renewables through their utility's green power program. Participating customers usually pay a premium through an additional line item on their electric utility bill. In 2015, NREL estimates that nearly 790,000 electricity end users participated in utility green power programs.2
As shown in Figure 4, from 2006 through 2015, the average retail price premium over the standard offering for residential utility green power products has mainly hovered around $20/MWh, or around $0.02 per kWh1. For the average American home, this equates to an approximate $18 per month price premium . Retail prices for non-residential consumers are generally lower given their purchasing power, but average non-residential retail price premiums3 are not available since these prices are often bi-laterally negotiated between the utility and the non-residential energy consumer.
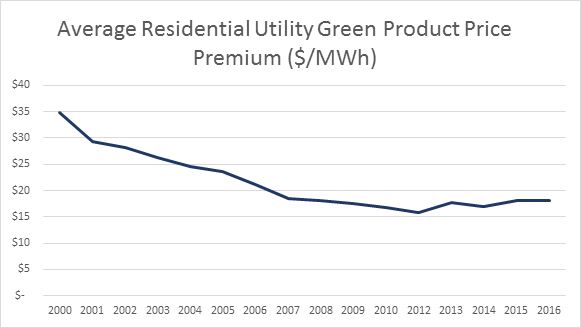 Figure 4: Average retail price premiums for residential utility green power products (Source: National Renewable Energy Laboratory)
Competitive green power products are an optional product offering that allows customers in competitive or restructured markets to procure bundled renewable electricity from their default utility supplier, or from an alternative competitive electricity supplier. As with utility green power programs, participating customers usually pay a premium over their standard electric offering as a line item on their utility bill in return for green power (electricity bundled with RECs). In 2015, NREL estimates that more than 1.5 million electricity end users participated in competitive supplier green power programs2.
Historically, NREL has not tracked the retail price of green power products of competitive suppliers, so no data is available to demonstrate average retail prices.
Power Purchase Agreements
To date, power purchase agreements (PPAs) with off-site renewable energy generators have mainly been used by large non-residential customers that want to directly engage with green power projects. The prices in this section are for illustrative purposes and solely reflect PPAs that utilities and electricity providers have signed that bundle the sale of both electricity and RECs. PPAs, however, come in many different forms (i.e., physical vs. financial), and may or may not include the physical delivery of electricity and the associated RECs from specific green power projects. Because of this, PPA pricing is highly dependent on the structure of the deal. PPAs with institutional off-takers, such as Green Power Partners, are often financial PPAs arrangements in which the project developer enters into a “contract for differences” with the off-taker around an agreed-upon strike price. These strike prices are rarely disclosed publicly and consequently data on PPAs with institutional off-takers is limited.
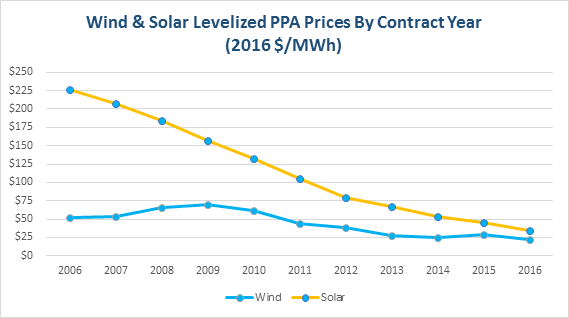 Figure 5: Prices of solar and wind PPAs, levelized over the full contract term (Source: Lawrence Berkeley National Laboratory)
As shown in Figure 5, the national average levelized price (levelized over the full term of each contract) of wind PPAs in the U.S. topped out at $70/MWh in 2009 and dropped to $22/MWh in 20164. The rise in prices through 2008 is attributed to a decline in the value of the U.S. dollar compared to the Euro; increased input prices of materials, energy, and labor; increased turbine manufacturer profitability; increased costs for turbine warrantees; and an upscaling of turbine size. Wind turbine prices have decreased substantially since 20085, due to a reversal of many of these trends in addition to an increase in competition among turbine manufacturers and cost-cutting measures by component suppliers. This 20 to 40 percent price decline since 2008 has been met with significantly improved turbine technology and increasingly favorable terms for turbine purchasers, leading to even lower prices for consumers. With these lower prices, more companies are engaging with PPAs. View Rocky Mountain Institute's Business Renewables Center deal tracker Exit, which features publicly-announced PPA deals with corporate and institutional off-takers (most of which are financial PPAs).
Solar PPA prices have fallen even more drastically than wind: between 2006 and 2013, levelized PPA prices for ground-mounted solar photovoltaic arrays larger than 5 MWAC in capacity fell by an average of $20-$30/MWh annually and by $11/MWh from 2015 to 2016 to $35/MWh6. Reasons for the steady decline in solar PPA prices since 2006 include lower installed project prices, improving capacity factors, and a decline in operation and maintenance costs. California, the Southwest, and Texas have the lowest solar PPA prices, and regions such as the Midwest are not far behind. Additionally, solar is becoming increasingly cost competitive with other green power options such as wind.
Self-Supplied Solar
Many residential and commercial end users choose to purchase their own solar photovoltaic (PV) systems and be responsible for its maintenance and operation. By owning their own system, they are able to self-supply their own green power.
Installed prices per watt for solar systems have declined significantly in the past decade, from about $9 per direct current watt (WDC) in 2006 to $4/WDC or below in 20167, as shown in Figure 6. These figures reflect the up-front price paid by the system owner (residential and non-residential) prior to the receipt of any incentives. Several different factors can influence the prices of installed solar PV, including system size (the larger the system, the lower the installed costs), installer, location (including state and local regulations), module and system type, and soft costs.
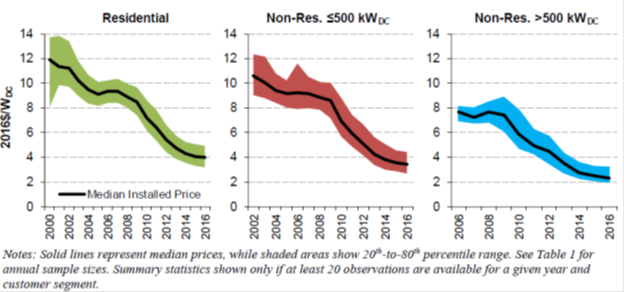 Figure 6: Median installed price per watt of self-supplied solar arrays (Source: Lawrence Berkeley National Laboratory)
1 Source: Greentech Media: East Coast SREC Prices Hit New Lows Exit
2 Source: National Renewable Energy Laboratory, Status and Trends in the U.S. Voluntary Green Power Market (2015 Data) (PDF) (52 pp, 6.2MB) Exit
3U.S. Energy Information Administration Exit reports that the average American home uses 10,932 kWh of power annually.
4 Source: Lawrence Berkeley National Laboratory Exit
5 The reason for temporary price spike in 2015 is due to the small sample size (six projects totaling 401 MW) that is dominated by two higher-priced contracts totaling 300 MW.
6 Source: Lawrence Berkeley National Laboratory Exit
7Lawrence Berkeley National Laboratory, Tracking the Sun 10: The Installed Price of Residential and Non-Residential Photovoltaic Systems in the United States. Exit