Estuary Data Mapper (EDM) and Land-Use Scenarios
Estuary managers and decision-makers who are planning for change 10, 20, or even 50 or more years into the future can benefit from several of Estuary Data Mapper’s (EDM) scenario-planning data sources.
This information can help estuary managers take projected environmental changes (such as of land development or air pollution) into account as they help plan strategies to protect these vulnerable landscapes.
Specifying and retrieving scenario data follows the same steps as with any other EDM operation, but the special nature of scenario planning requires knowing the specific data sources that will return the information you want.
This page introduces one source of future scenario data: projections of population growth and associated land-use change using Integrated Climate and Land-Use Scenarios (ICLUS).
Integrated Climate and Land-Use Scenarios (ICLUS)
Land use, on its own, can aggravate or ease climate-change effects. As people move into previously uninhabited land areas, houses, pavement, parking lots, highways, and other modifications and structures create impervious surfaces that affect aquatic ecosystems and water quality.
EPA’s Integrated Climate and Land-Use Scenarios (ICLUS) project explores future changes in human population, housing density, and impervious surface for the United States. The ICLUS tools, datasets, and models enable users to generate, visualize, and analyze spatial datasets about residential housing growth in the coterminous US.
ICLUS also has a Web-based tool so you can view this information interactively.
The ICLUS projections are broadly consistent with peer-reviewed storylines of population growth and economic development that are now widely used by the climate change impacts community. The site includes a good overview of the project and how it developed its residential land-use projections.
Five Housing Density Scenarios
For this tutorial, we will use ICLUS Version One projections based on the Intergovernmental Panel on Climate Change’s (IPCC) Special Report on Emissions Scenarios (SRES).Exit
ICLUS Version 1 describes five housing-density scenarios drawn from residential land use projections for all counties in the coterminous United States for the decades 2010 through 2100.
- Fertility
- Mortality
- Immigration
County-level population projections were used to calculate demand for new houses. Then, a statistical model was used to estimate the amount of impervious surface that results from this new residential development.
ICLUS Version 2 updates some of the key inputs and includes a modified geographic framework.
EDM contains all five of the Version 1 scenarios for population and impervious surface projections. EDM includes ICLUS Version 2 population data for two of its scenarios.
A1, A2, B1, B2, and BC
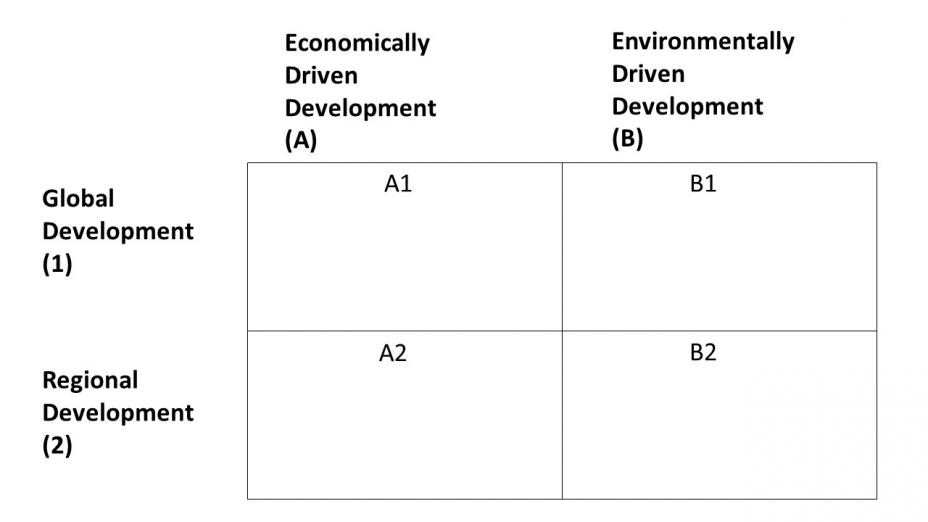
- Economic versus environmentally-driven development (A-B)
- Global versus regional development (1-2)
These make up four storylines: A1, A2, B1, and B2. The following image illustrates the grid we will use to summarize the assumptions and parameters.
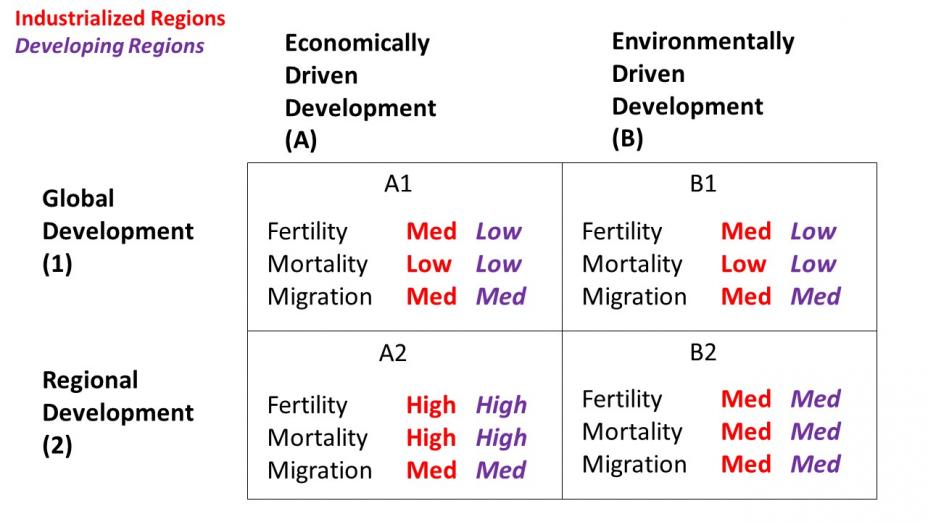
Each storyline projects numbers for fertility, mortality, and migration rates from 2010 through 2100, drawn from US Census Bureau data and projections. For each measure, the data projects low, medium, and high estimates for both industrialized and developing regions. The following image summarizes the fertility, mortality, and migration assumptions for each scenario.
The fifth scenario is the Base Case (BC), where all parameters are set to Medium.
What the Parameters and Assumptions Mean
The text for the following table is drawn from the ICLUS Version 1 final report, pages 2-2 through 2-4.
| Scenario | Description |
|---|---|
| A1 |
|
| A2 |
|
| B1 |
|
| B2, BC |
|
Using EDM, you can select a scenario and visualize the impact of rising populatiion on an area's land use, as undeveloped land is replaced by more impervious surface.
ICLUS v2 Data in EDM
- Population:
- Decadal county population data for 1990-2010
- Projected decadal county population data for Shared Socioeconomic Pathway (SSP) scenarios SSP2 and SSP5 for 2020-2100
- Land Use: gridded data and estuarine watershed summaries for 2000-2100
ICLUS Version 1 modeled population, residential development, and impervious surface cover changes by decade to the year 2100. Those modeling choices and assumptions were intended to be consistent with four scenarios from the Intergovernmental Panel on Climate Change (IPCC).
ICLUS v2 was designed to be consistent with a more recent IPCC scenarios framework, drawing from two Shared Socioeconomic Pathways (SSPs) and two Representative Concentration Pathways (RCPs).
- Updated input data
- Integration of changing climate variables within the migration model
- Inclusion of transportation network capacity and increase over time
- Growth in commercial and industrial land uses
- Population density-driven demands for residential housing and commercial and industrial development
Tutorial: Retrieving ICLUS Data from EDM
- Step 1: Retrieving Impervious Surface Data for Scenarios BC and A2
- Step 2: Retrieving Population Data for Scenarios BC and A2
- Step 3: Comparing BC and A2 Scenario Projections
- Step 4: Saving the Data
Step 1: Retrieving Impervious Surface Data for Scenarios BC and A2
- With EDM open, select the Zoom Maps tab.
- Select Watersheds and Coastal Tributaries.
- Select State > Maryland.
- Select Watershed > MD Patuxent River.
- Select the Get Data tab.
- Select the Land Use option.
- Select the Land Use button to display the data products available. At the bottom of the dropdown list you’ll see the base scenario and four future scenarios for ICLUS impervious cover projections.
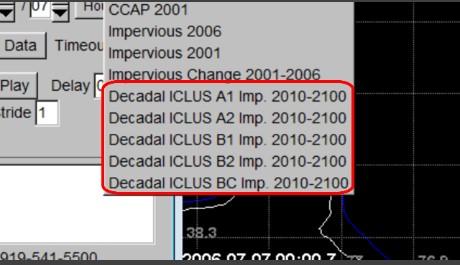
- Select the BC scenario. Hover the cursor over the button for a tooltip description of the data.
- In the Date box, enter 2010.
- The ICLUS data is organized by decade rather than by year. So select the Hours button and select Years from the picklist.
- Enter 90 in the text box beside the Years button. This will retrieve ICLUS projections for the next 90 years.
- Select Retrieve.
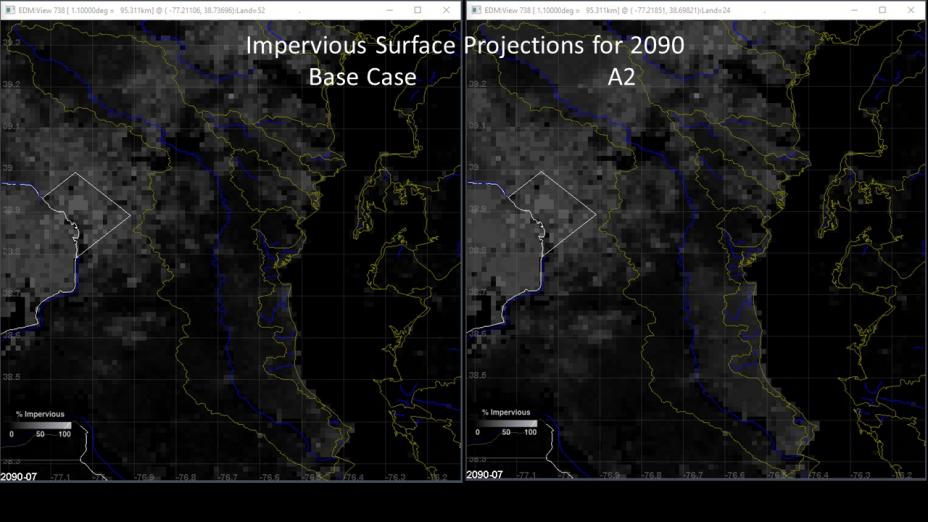
- To view the time series between 2010 and 2100, select the Play button. The patches of gray that you see in the Display window represent the percentage of land that is projected to be covered by impervious surface.
- Enter 10 in the Stride box.
- Select the arrow buttons on either side of Timestep to scroll through the animation decade by decade.
- Now we want to select the A2 storyline to compare it to the base case. Select Land Use > ICLUS A2 then select Retrieve. Select the Timestep buttons to step through the decades from 2010 to 2100.
-
You can see that there is more development projected under scenario A2 by the year 2090 than for the Base Case. The A2 scenario predicts slower economic growth, with an increase in fertility and average household size. This is the highest ICLUS population projection and for most areas of the U.S. represents a "worst case" pattern of development.
Step 2: Retrieving Population Data for Scenarios BC and A2
- De-select Land-Use.
- Select Population. Make sure ICLUS1 is selected.
- From the data products list to the right of the ICLUS1 button, Select BC Yearly Pop. Den.
- With 2010 and 90 Years still entered for the Date range, select Retrieve.
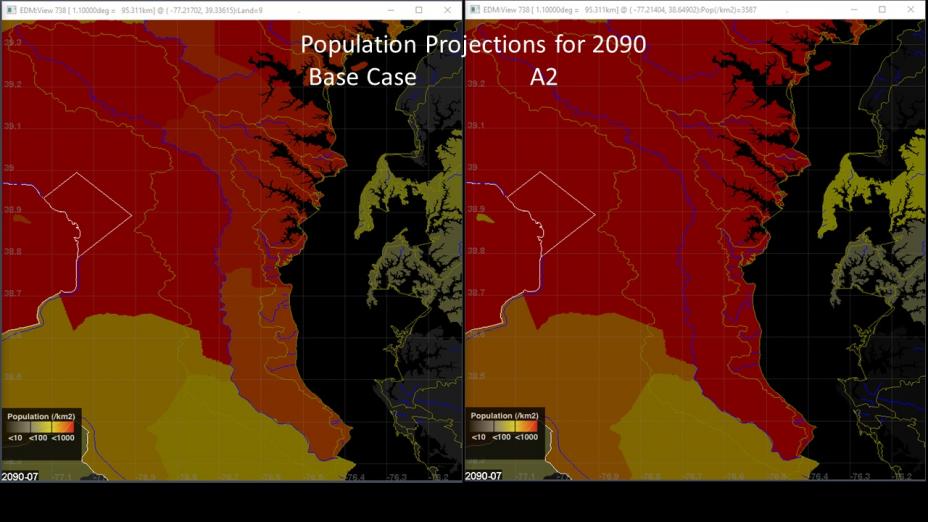
- Click Timestep to scroll through the decades. Orange and red denote higher population density.
- Select A2 Yearly Pop. Den. and then select Retrieve.
- As the image below illustrates, ICLUS projects higher population estimates for A2 by the year 2090 than for the Base Case.
Step 3: Comparing BC and A2 Scenario Projections
- Toggle Land Use (impervious cover) back on. The Population button should still be active.
- Select the “BC” scenario for both the Land Use and Population-ICLUS1 menus, and select Retrieve.
- Use the Timestep buttons to scroll through through the visualizations to see the ICLUS projections for the year 2090. If you cannot see the impervious cover and population projections at the same time, you may need to toggle the Population option off and on.
- Select A2 for Land Use and Population.
-
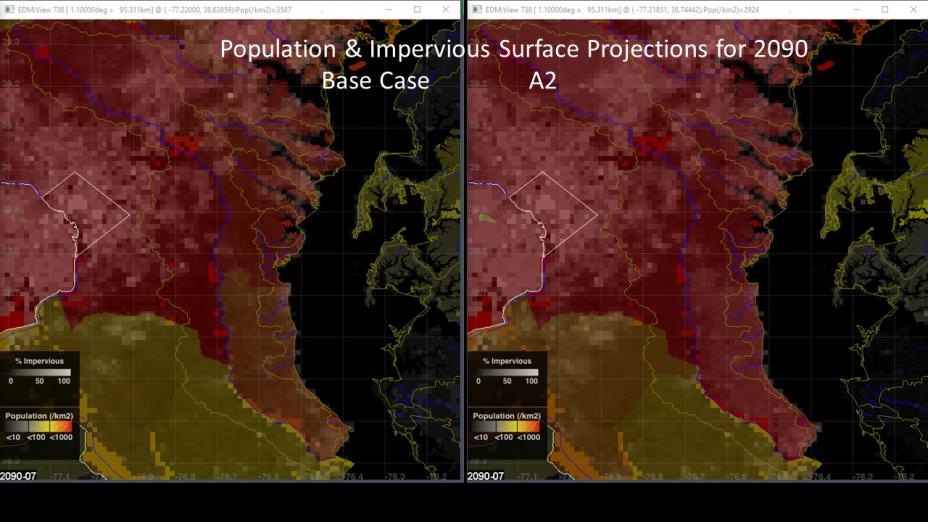
The following image shows a side by side comparison of the Base Case and A2 scenarios for the year 2090. The A2 scenario shows much more impervious cover across the region than does the Base Case.
Step 4: Saving the Data
You can save any data you have retrieved and are viewing in EDM.
- Save Data (ASCII Grid). This option saves only one decade of projections at a time.
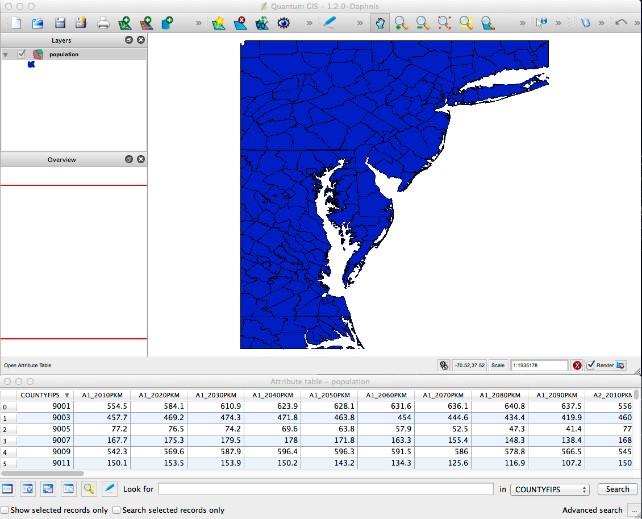
- Save Data (Shapefile). This option retrieves a single file with each decade saved as a separate attribute. The following screenshot shows the file population.dbf opened in the open-source QGIS Exit geographic information system. In the Attribute Table, we can see the data for each county by decade.