Estuary Data Mapper (EDM) Image Gallery
The Estuary Data Mapper (EDM) is a free, interactive graphical application under development by the US EPA that allows scientific researchers to quickly and easily view, retrieve, and save data of interest to estuary researchers and decision-makers.
The following screenshot gallery illustrates the types of data that EDM makes available.
 EDM interface displaying CMAQ-WDT dataset variables and results
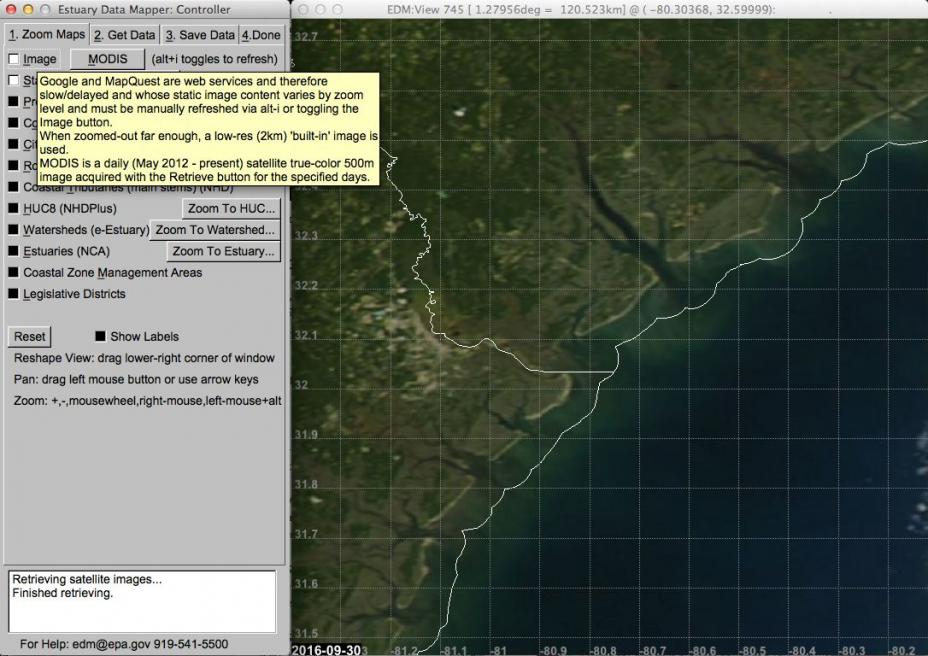 MODIS reflectance true-color image data comes from daily satellite images taken from May 2012-present.
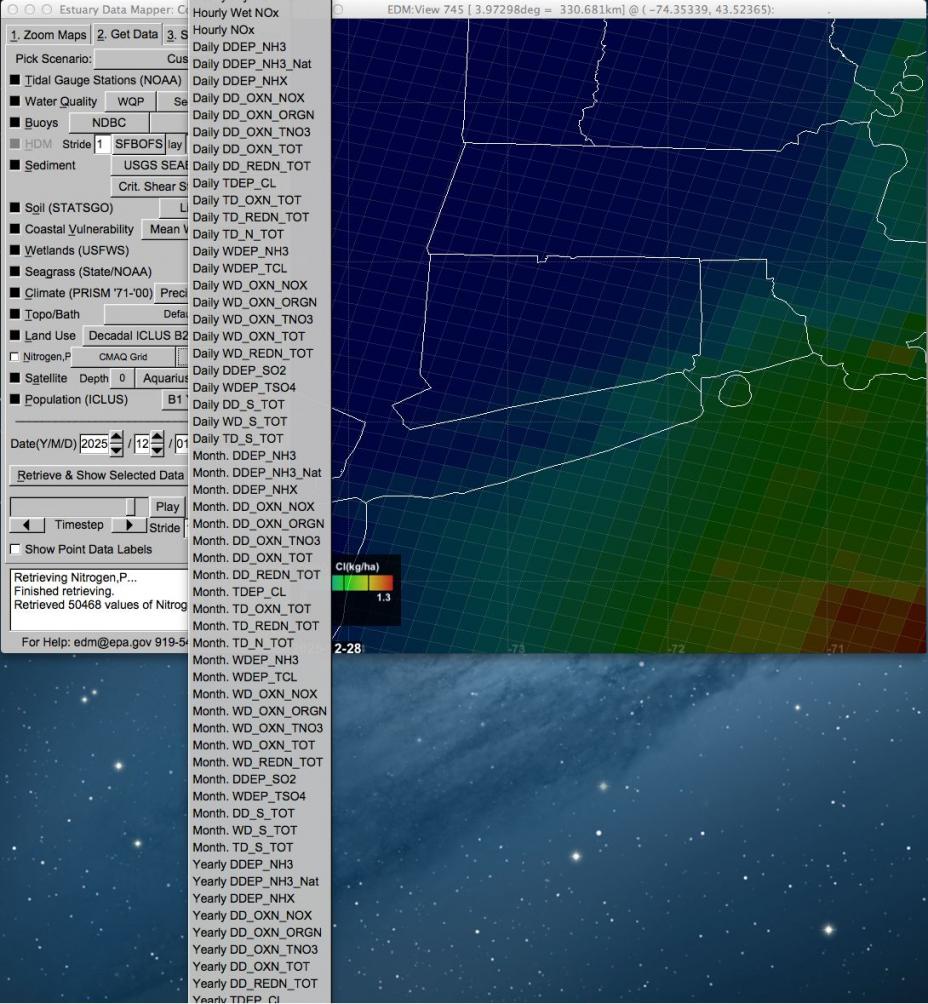
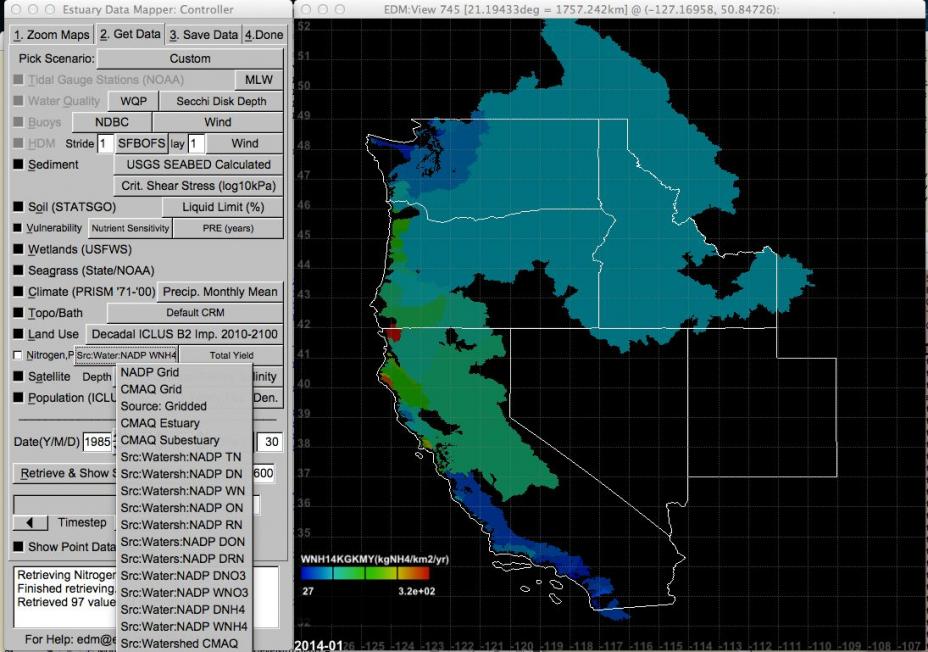 EDM with nitrogen dataset
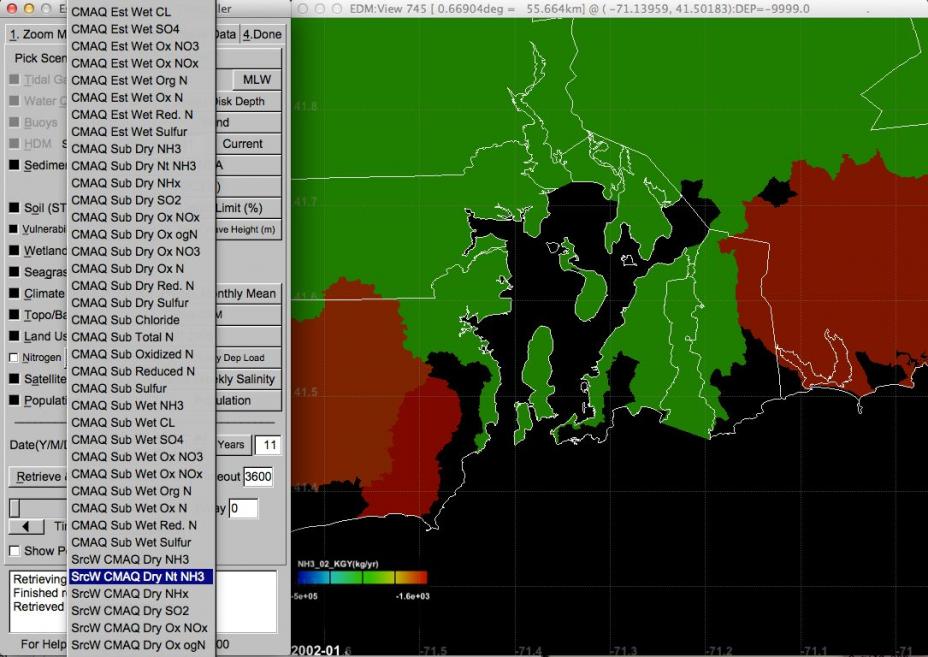 EDM with CMAQ nitrogen deposition data
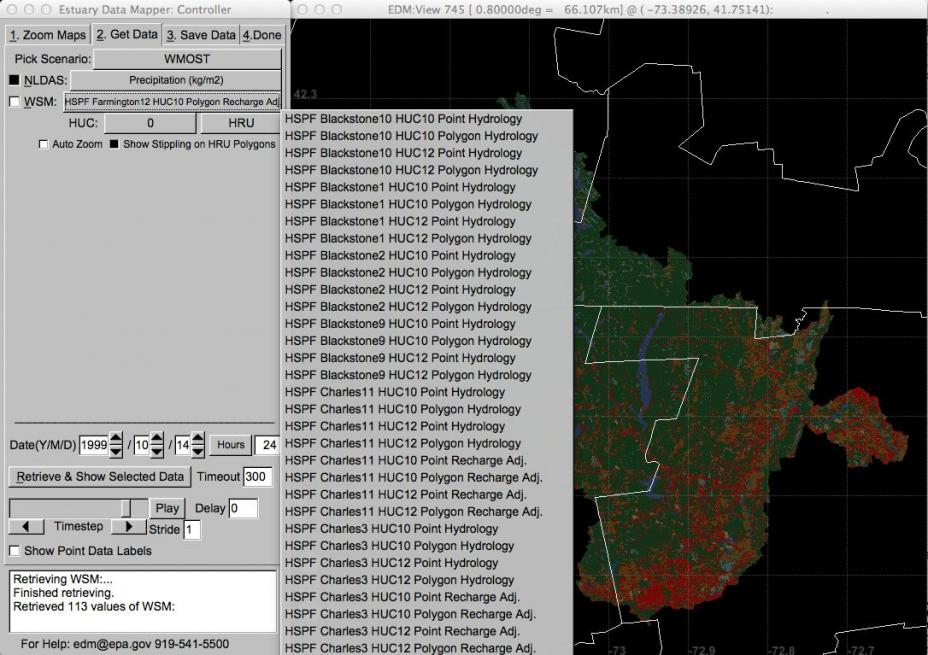 EDM with watershed model (WSM) results
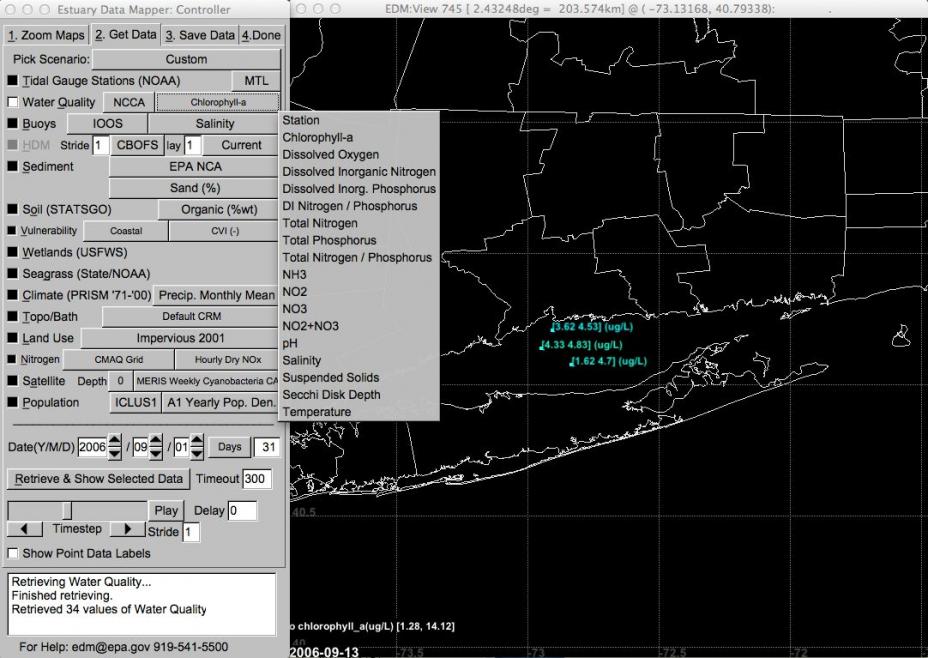 EDM display of NCCA Water Quality data
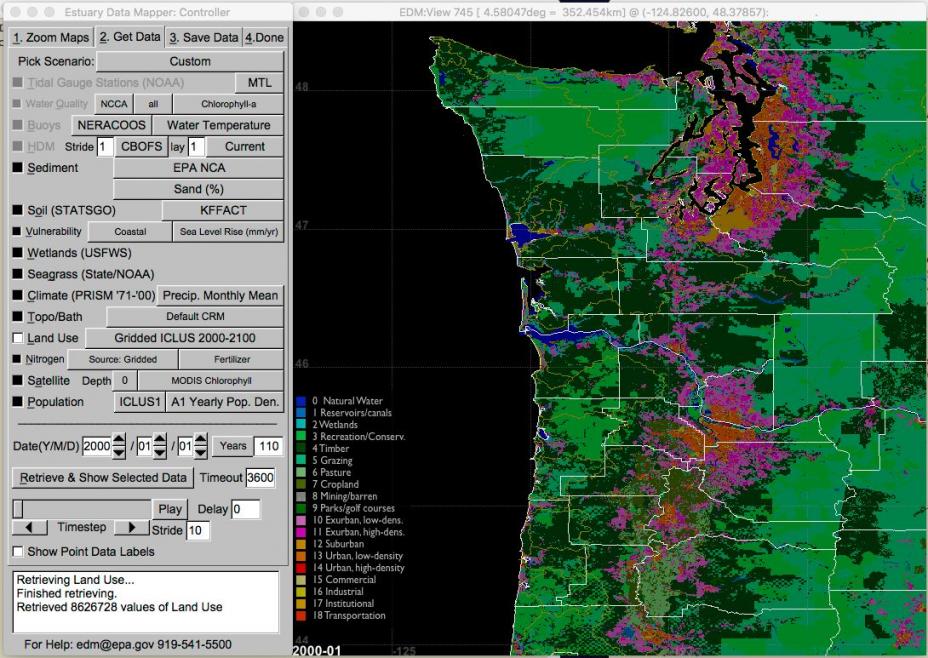 EDM screenshot of gridded ICLUS data
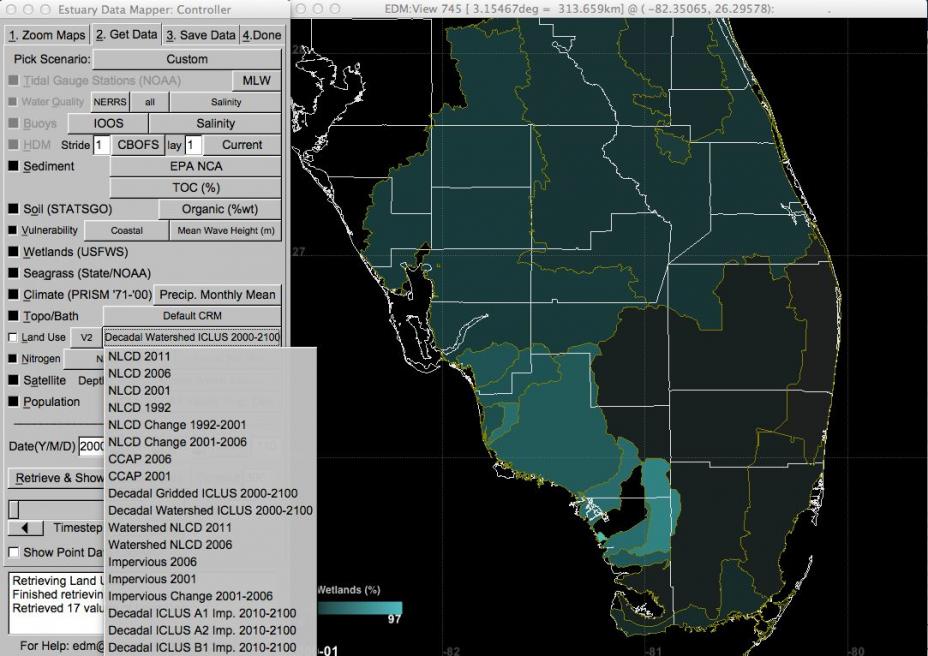 EDM screenshot of ICLUS watershed data
 Multiple data layers: e.g. gridded deposition, water quality, tidal gauge stations, etc. retrieved with one click and displayed and saved in seconds
 One-click dataset selections to show popular scenarios and for convenient export to decision-support tools
 Sediment core samples
 Land use (30-meter resolution)
 Topography/Bathymetry
 Polygonal Data: Wetlands, Temperature, etc.
 Polygonal Data: Wetlands, Temperature, etc.
 Satellite-measured water-quality data
 Modelled meteorology and hydrodynamics data
 Modelled coastal vulnerability data
 High-resolution satellite imagery
 High-resolution satellite imagery
 Saving EDM data to file formats for import to GIS tools, such as ArcGIS and Google Earth
 EDM subsetted data imported into Quantum GIS
 EDM subsetted data displayed in Google Earth