Estuary Data Mapper (EDM) Release History
- December 7, 2020
- June 13, 2019
- May 6, 2019
- September 15, 2017
- August 29, 2017
- August 11, 2017
- July 21, 2017
- April 4, 2017
- January 30, 2017
- November 23, 2016
- October 7, 2016
- October 3, 2016
- July 30, 2016
December 7, 2020
- Nutrient Sensitivity Scenario that includes both the original Nutrient Sensitivity data (moved from the Vulnerability data button's Source Menu) plus the new Stream Discharge data (Yearly and Monthly USGS gauges and NHD flowlines). Additional variables related to estuarine nutrient sensitivity will be added over the next few months.
-
VT/NH High resolution impervious data to the Green Development Scenario.
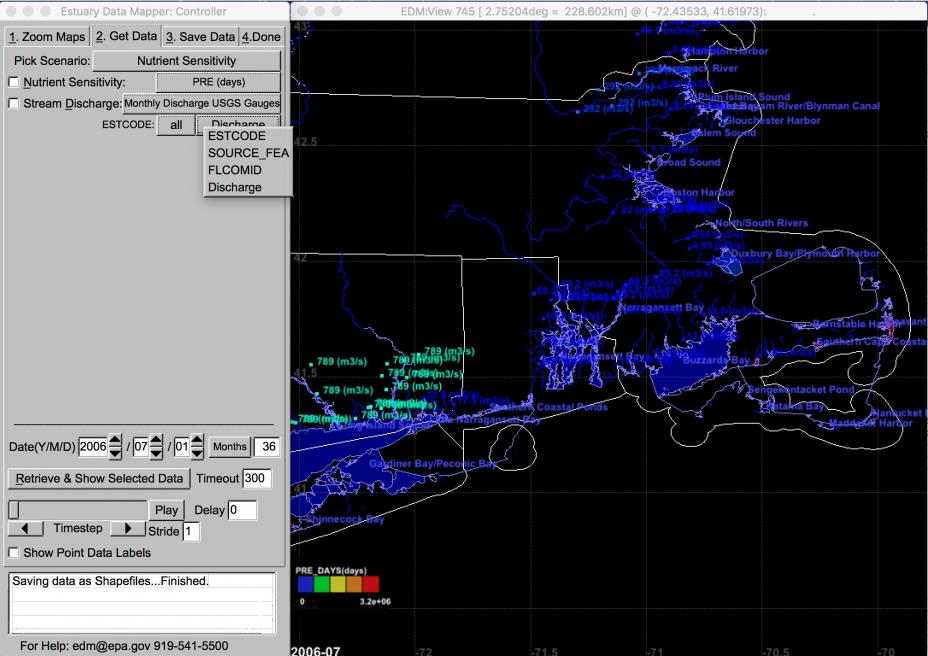 The Nutrient Sensitivity Scenario includes both the original Nutrient Sensitivity data and the new Stream Discharge data.
June 13, 2019
Updated with new lakes for the Great Lakes region.
May 6, 2019
- New map files for 10 regions.
- Added new HDM: GOMOFS (Gulf of Maine).
- Added new HDM: CIOFS Cook Inlet, AK.
- Added new variable dissolved oxygen to HDM: CBOFS (Chesapeake Bay, VA).
- Removed defunct HDM: GBOFS (Galveston Bay, TX).
- Removed Google map image since it is no longer free.
September 15, 2017
- National Land Cover Database (NLCD) 2011 and NLCD 2006 (replaces the old data)
- Watershed NLCD 2011
- Watershed NLCD 2006
- Decadal Gridded Integrated Climate and Land-Use Scenarios (ICLUS) 2000-2100
- Decadal Watershed ICLUS 2000-2100
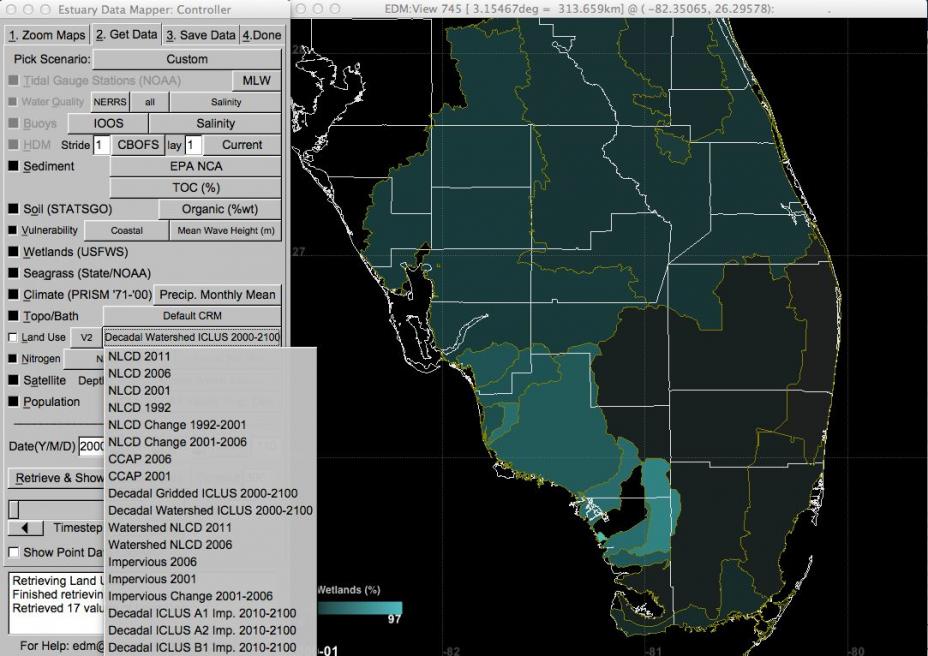 Land Use variables for ICLUS Version 2, with retrieved data in the display window
August 29, 2017
Added the following dataset: updated gridded ICLUS data (full boundary). This release also contained workarounds for reported startup errors on Windows 10.
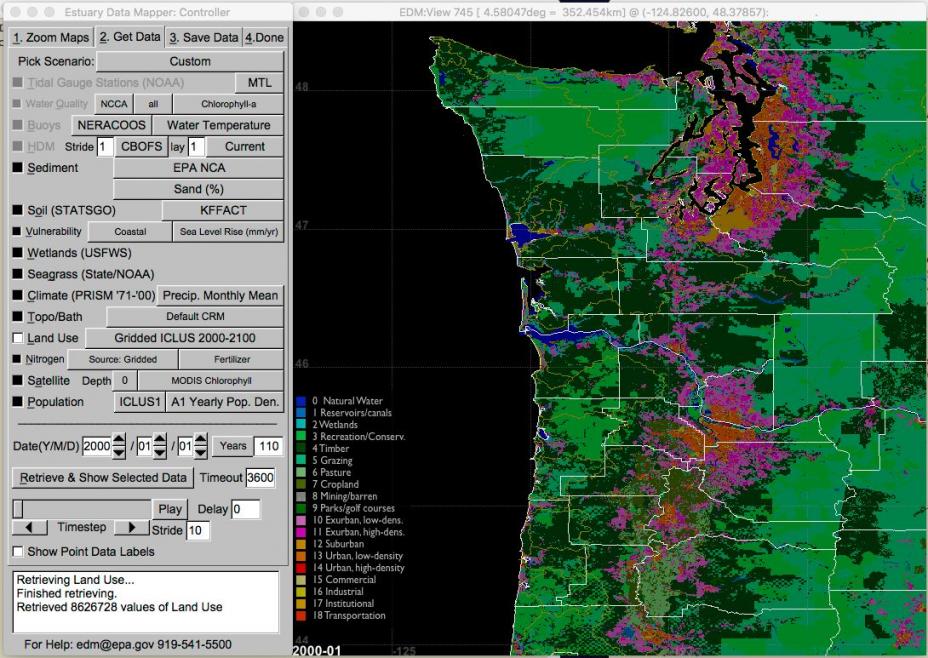 EDM displays gridded ICLUS projected data for the years 2000-2100.
August 11, 2017
Added the following dataset: National Coastal Condition Assessment (NCCA) water quality data for 1999-2010.
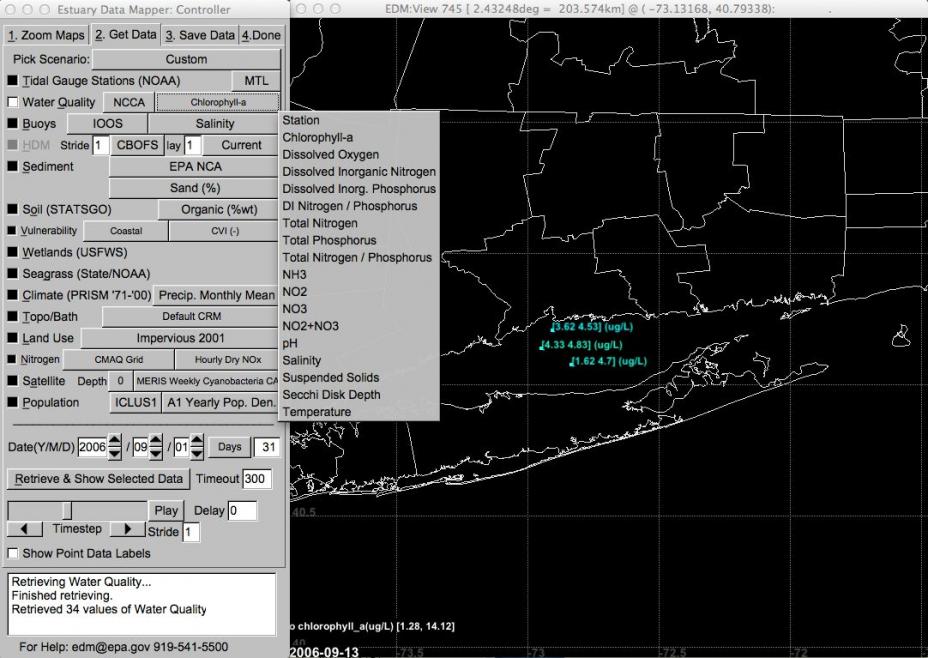 NCCA water quality data for the years 1999-2010 are available in EDM. Shown here are the variables available from the NCCA submenu.
July 21, 2017
Added in this version: new watershed model (WSM) datasets for use in the US EPA Watershed Management Optimization Support Tool (WMOST) application.
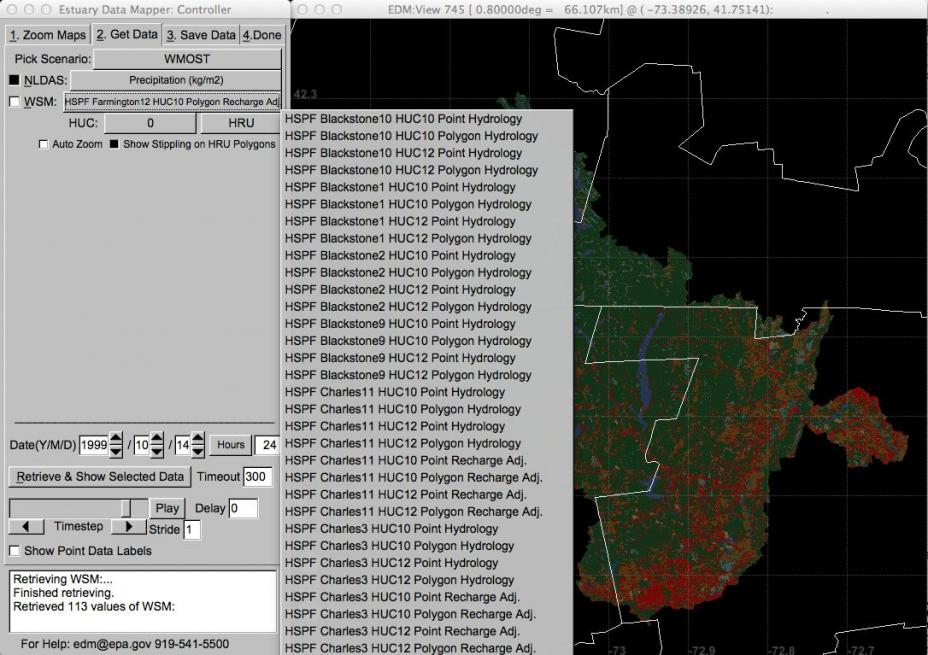 Watershed model (WSM) variables available from EDM, with results shown in the display window.
April 4, 2017
- Integrated Climate and Land-Use Scenarios (ICLUS) Version 2 population data
- HSPF (Hydrological Simulation Program—Fortran) watershed characteristics data, an input to the US EPA Watershed Management Optimization Support Tool (WMOST); HSPF data available in comma-separated values (CSV) format
- Community Multi-scale Air Quality (CMAQ) nitrogen deposition to estuaries, subestuaries, and watersheds
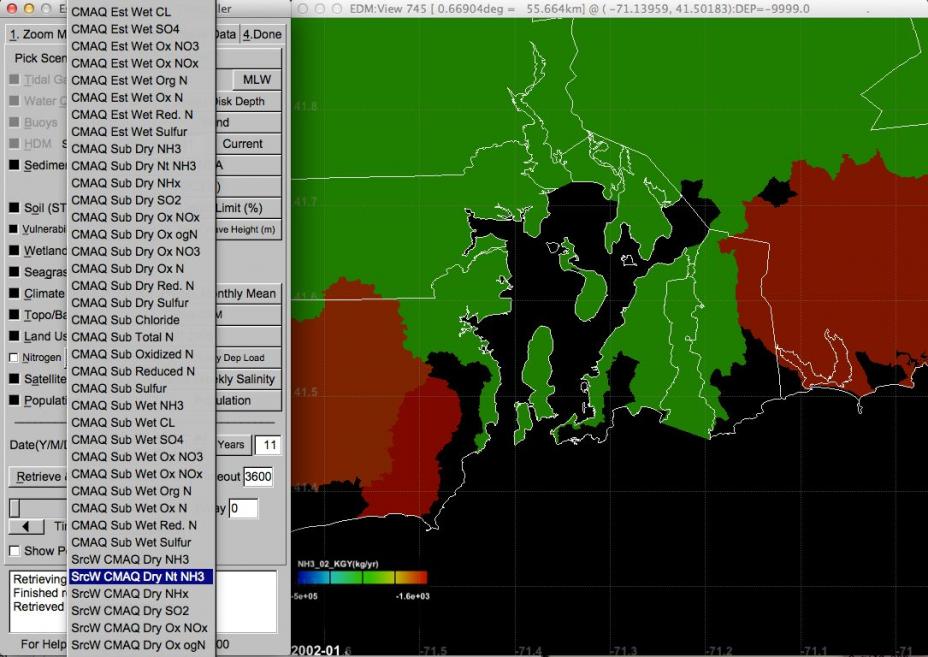 CMAQ nitrogen deposition data variables selectable from the EDM menu, with results in the display window.
January 30, 2017
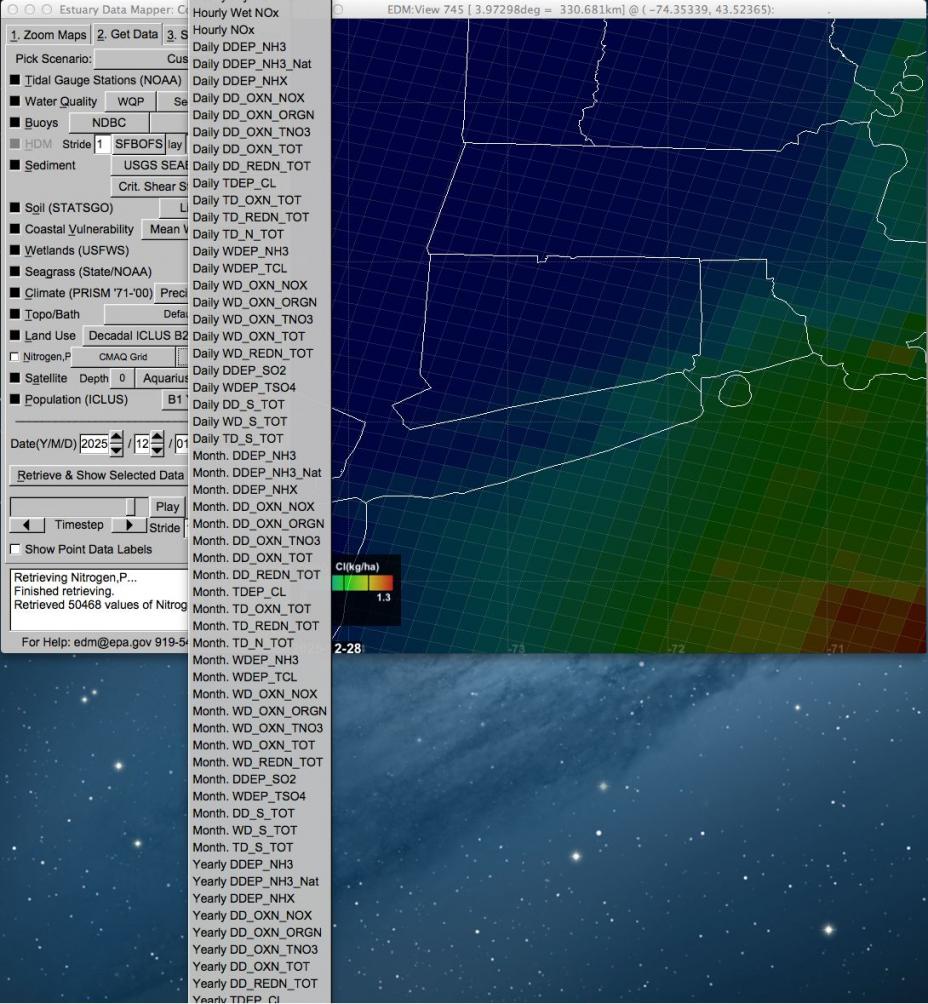
Added the following dataset: National Atmospheric Deposition Program (NADP) Exit+ Community Multi-scale Air Quality (CMAQ) gridded data. Accessible from the Get Data tab > Nitrogen > NADP+CMAQ Grid. The following screenshot shows the variables available for selection, with gridded data rendered in the display window.
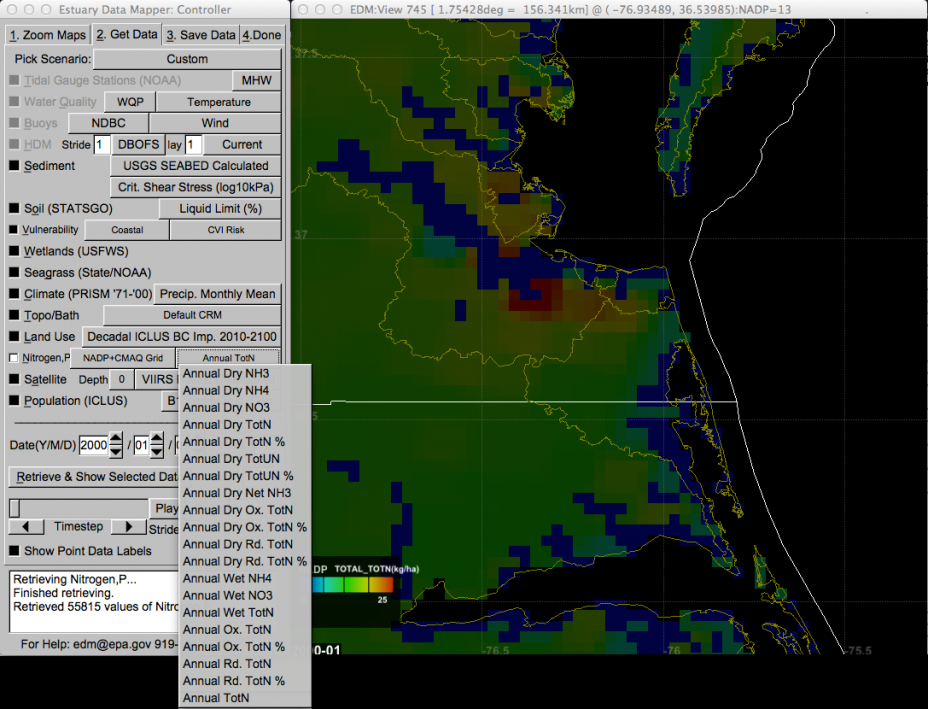 CMAQ and NADP data variables displayed in the EDM menu, with gridded data rendered in the display window.
November 23, 2016
Added a Nitrogen dataset from the National Atmospheric Deposition Program (NADP). Exit
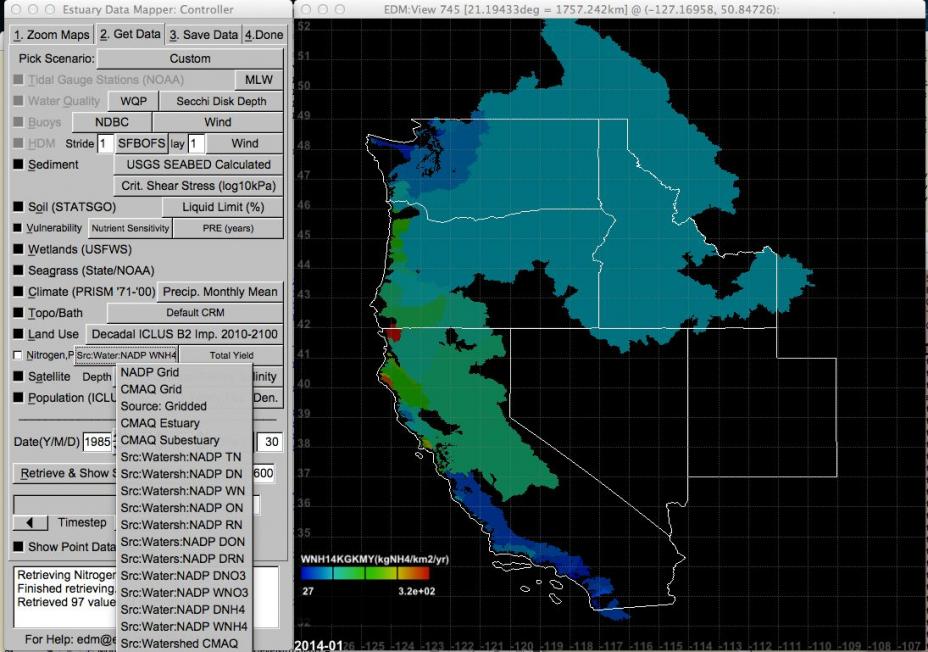 Nitrogen data variables from the National Atmospheric Deposition Program (NADP), with data shown in the display window.
October 7, 2016
Added a new set of Community Multi-scale Air Quality (CMAQ) -Watershed Deposition Tool (WDT) data with an updated EDM variable menu.
 Community Multi-scale Air Quality (CMAQ)-Watershed Deposition Tool (WDT) nitrogen deposition variables available from EDM, with gridded results shown in the display window.
October 3, 2016
EDM implements Moderate Resolution Imaging Spectroradiometer (MODIS) reflectance true-color (500m resolution). This image source differs from the existing MapQuest and Google images in that it is a daily satellite image (from May 2012 to present).
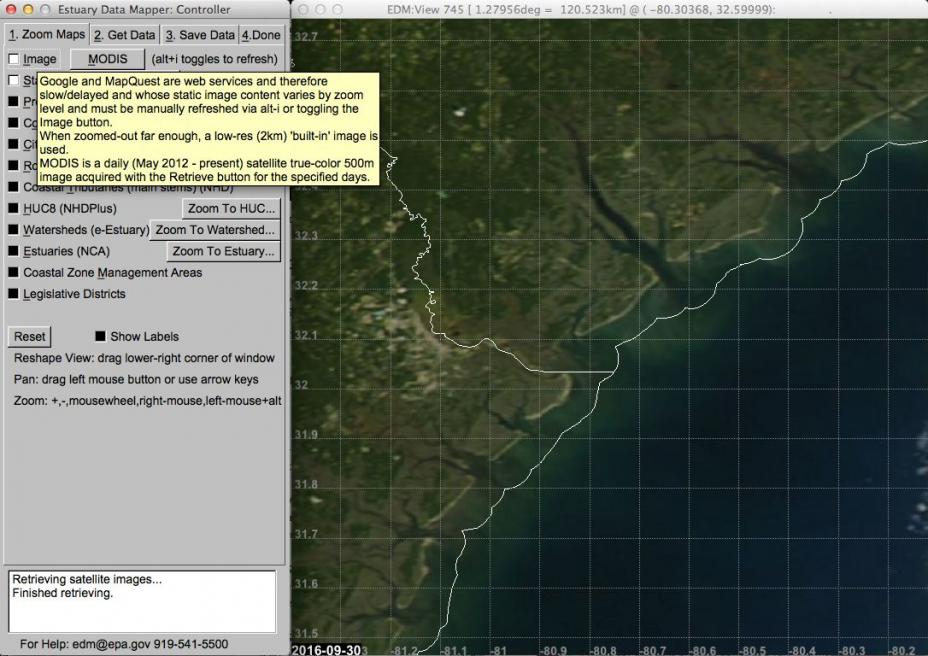 EDM implements Moderate Resolution Imaging Spectroradiometer (MODIS) reflectance true-color (500m resolution) images. This image source differs from the existing MapQuest and Google images in that it is a daily satellite image, taken from May 2012 to present).
July 30, 2016
EDM now has a new .dbf +.csv file output format for shapefiles. Exit When saving time-varying data to Shapefiles, a .csv file is produced containing the time-varying data while the .dbf file contains only static information about the shapes.
The number of .dbf rows matches the number of shapes, whereas the number of rows in the csv file = shapes x timesteps (less any missing data -9999 which is not written).
If small enough, the .csv file can be loaded into QGIS Exitand manually “related” to the shp data, thus producing a time-series avoiding the previous custom workarounds to the .dbf file format limit of 255 column.
- ID is an integer index that matches the shape index [0..shapes-1].
- Station will only be present if the data has a string station name.
- Longitude and Latitude will always be present. For non-point data this is the shape centroid.
- Depth(m) is present only for data that has depth (or may just be 0).
- The date-time column will be named according to the timestep size: YYYYMMDDHH or YYYYMMDD or YYYYMM or YYYY.
- The time-varying scalar data value will be in a column named Value. For 2D/3D vector data (wind, current) the columns will be U_Value, V_Value, W_Value.
- The lines in the csv file are ordered by ID then Time.
- For the following point data, EDM allows timestep size of either Hours (up to one month = 744 hours) and now Days (up to one year = 366 days) for point data:
- NOAA's Tidal Gauge Stations
- Water Quality
- Buoys
- Data aggregation:
- For sub-hourly data (e.g., STORET Discharge), multiple values within an hour from a given station (rare) are aggregated to create a mean hourly value (as before).
- Likewise, when timestep size is Days, now multiple sub-daily values from a station are aggregated to a mean daily value.
- Requests for many values, such as for the entire Atlantic Coast, take a long time. e.g., STORET Discharge takes about 20 minutes. The user will need to increase the Timeout (in the EDM Controller), e.g., to 3600 seconds, to accommodate such long, hopefully rare, requests.
- For point data, when timestep size is Days, there will be more points in the View with even more labels obscuring each other. The user can turn-off “Show Point Data Labels” to avoid visual clutter.
- The DBF files saved by EDM have a column per timestep of data, but not necessarily all timesteps in the range. EDM only generates a column if at least one site has data for that day thus minimizing the number of output columns.