Examples of Integrated Assessments for Watershed Health
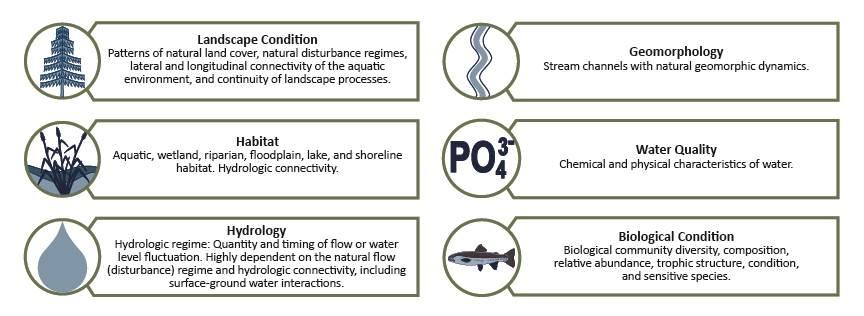
Healthy watersheds integrated assessments are based on an assessment of:
- Landscape Condition
- Habitat Condition
- Hydrology
- Geomorphology
- Water Quality
- Biological Condition
- Vulnerability
Multimetric indices or other methods may be used to integrate multiple indicators representing different healthy watersheds attributes. Healthy watersheds integrated assessments can range from screening-level assessments using GIS data layers to statistical and geospatial modeling of ecological attributes.
- EPA Healthy Watersheds Program Integrated Assesment Reports
- National Integrated Assessment Reports
- State Integrated Assessment Reports
- Local Integrated Assessment Reports
You may need a PDF reader to view some of the files on this page. See EPA's PDF page to learn more. Most of the following links exit the site. EXIT
EPA Healthy Watersheds Program Integrated Assessment Reports
This section presents links to Healthy Watersheds Integrated Assessment reports, which are detailed technical documents that present the results of comparative measurement of a series of watershed health and vulnerability indices across large areas encompassing tens of thousands of watersheds. Several are statewide-scale efforts undertaken in partnership with state agencies and non-governmental organizations; others are targeted studies of specific ecological regions or river basins. Statewide assessments have included California, Wisconsin, Alabama and Tennessee. Targeted assessments have included the Taunton River Basin, the Clinch River Basin, the Mobile Bay Watershed and the Montana Prairie Potholes Region. Preliminary Healthy Watersheds Assessments covering the entire lower 48 states were carried out during 2015-2016.
Alabama and Mobile Bay Basin Integrated Assessment of Watershed Health (PDF) (50pp, 12 MB) The EPA Healthy Watersheds Program, Alabama Department of Environmental Management, and Mobile Bay National Estuary Program conducted an integrated assessment of relative watershed health throughout Alabama and the Mobile Bay Basin. Twelve metrics were selected to describe landscape condition, hydrologic condition, habitat condition, geomorphology, water quality and biological condition. Metrics were quantified for each NHDPlus Version 2 catchment in Alabama and the Mobile Bay Basin using a combination of existing GIS layers and statistical models that predicted values of stream habitat condition, stream chemistry and stream biological condition metrics.
Statistical models used landscape variables such as land cover, soil attributes and topography as predictors of stream conditions within each catchment. Metrics were combined into an overall Watershed Health Index and scores were mapped across Alabama and the Mobile Bay Basin to highlight priority areas for protection. In addition, an assessment of hydrologic connectivity to Mobile Bay was conducted for catchments in the Mobile Bay Basin using three metrics that described a catchment’s potential for water and material export and degree of downstream attenuation.
Connectivity metrics were combined into a Mobile Bay Connectivity Index that can be used in conjunction with Watershed Health Index scores to identify portions of the Mobile Bay Basin that are both healthy and highly connected to Mobile Bay and are therefore priorities for maintaining natural water, sediment, and nutrient inflows to Mobile Bay. To complement the analysis of watershed health and connectivity, four metrics describing the vulnerability of watersheds to future climate, land use and water use change were selected and quantified for NHDPlus catchments throughout the state and Basin. Vulnerability metrics were combined into a Watershed Vulnerability Index and index scores were mapped to further prioritize protection of watersheds that are healthy but vulnerable to future degradation.
California Integrated Assessment of Watershed Health (PDF) (118 pp, 8.5MB) The EPA Healthy Watersheds Program and California’s Healthy Streams Partnership conducted an integrated assessment of relative watershed health throughout California. Six metrics describing structural watershed characteristics relevant to aquatic ecosystem health were quantified from GIS layers for each NHDPlus catchment in the state. An additional six stream condition metrics (chemical constituent concentrations, physical habitat index scores, etc.) were quantified for NHDPlus catchments in non-arid regions using statistical models.
The models predicted values of stream health metrics based on a catchment’s land cover, soil attributes, topography and other landscape variables. Metrics were combined into a Watershed Condition Index and a Stream Health Index and scores across the state were mapped to highlight priority areas for protection. To complement the analysis of watershed health, eleven metrics describing the vulnerability of California watersheds to future climate, land use and water use change and wildfire risk were selected and quantified for NHDPlus catchments throughout the state. Vulnerability metrics were combined into a Watershed Vulnerability Index and index scores were mapped to further prioritize protection of watersheds that are healthy but vulnerable to future degradation.
Tennessee Integrated Assessment of Watershed Health (PDF) (105 pp, 8 MB) This statewide assessment was carried out in partnership with the Tennessee Healthy Watershed Initiative (THWI), a collaboration of federal, state and nonprofit organizations committed to maintain and improve water resources in Tennessee watersheds. The Assessment identified relative health of watersheds across the entire state of Tennessee at the catchment (approx. 1-mile square) level, based on metrics characterizing Landscape Condition, Geomorphic Condition, Hydrologic Condition, Water Quality, Habitat Condition and Biological Condition.
The scores from these six sub-indices were combined to create an overall Watershed Health Index. Results can be presented for each metric, sub-index or Watershed Health or Vulnerability Index at multiple scales. Geospatial datasets for all metrics and indices were delivered to the state and project partners along with an applications workshop at the project’s completion.
Wisconsin Integrated Assessment of Watershed Health (PDF) (111 pp, 9.3MB) The EPA Healthy Watersheds Program and the Wisconsin Department of Natural Resources (WDNR) conducted an integrated assessment of relative watershed health throughout Wisconsin. Fifteen metrics were selected to describe landscape condition, hydrologic condition, habitat condition, geomorphology, water quality and biological condition.
Metrics were quantified for each catchment in WDNR’s hydrography database using a combination of existing GIS layers and statistical models that predicted values of streamflow alteration, stream habitat condition, stream chemistry and stream biological condition metrics. Statistical models used landscape variables such as land cover, soil attributes and topography as predictors of stream conditions within each catchment. Metrics were combined into a Landscape Condition Index and an Aquatic Ecosystem Health Index. Index scores are being used for planning and evaluation of several WDNR watershed protection and restoration programs.
To complement the analysis of watershed health, seven metrics describing the vulnerability of Wisconsin watersheds to future climate, land use and water use change were selected and quantified for catchments in WDNR’s hydrography database throughout the state. Vulnerability metrics were combined into a Watershed Vulnerability Index and index scores were mapped to further prioritize protection of watersheds that are healthy but vulnerable to future degradation.
Strengthening the Resilience of the Taunton River Watershed (PDF) (108 pp, 8 MB) In partnership with EPA Region 1, The Nature Conservancy and local stakeholders, this project helped inform how Taunton communities decide on priority actions that would increase their overall resiliency and reduce their vulnerability to the converging impacts of climate change and development. In addition to convening new networking opportunities among the Taunton River watershed stakeholders, the Taunton project also inventoried existing data and developed a decision making framework and a database tool. The tool for applying this framework is the focus of this report.
The framework links specific ecosystem services to important features of the watershed landscape to create an interactive tool that should help communities find ways to maintain the functions and processes most beneficial to their specific conditions (i.e., to become more resilient). The tool itself is designed so that stakeholders and decision makers can easily weight the ecosystem factors that are of most concern to them for the protection of the various ecosystem services. It is also used to generate listings of top-ranked areas and export them for further examination, mapping and analysis.
Clinch and Powell River System Integrated Assessment of Watershed Health (PDF) (118 pp, 14 MB) The Healthy Watersheds Program worked with the Clinch–Powell Clean Rivers Initiative (CPCRI) and others to identify healthy watersheds in the Clinch and Powell River System. The Clinch and Powell River System, upstream of Norris Lake, is one of the last free-flowing sections in the Tennessee River basin. It provides a habitat for many aquatic species, particularly rare freshwater mussels. The system begins in the mountains of southwest Virginia and empties into Norris Lake near Tazewell, TN, draining an area of 1.7 million acres. The Powell River begins in Wise County, VA, and flows 120 miles (190 km) southwest where it joins Norris Lake. The Clinch River begins in Tazewell County, VA, and flows approximately 200 miles (300 km) before reaching Norris Lake.
The Clinch and Powell River System is home to one of the most diverse fish and mussel assemblages in North America, but over the years coal mining, agricultural activities and runoff from development have harmed this ecosystem. Despite these challenges, the watershed supports more than half of the native fish species currently in the Tennessee River basin, and at least 48 freshwater mussel species including 22 federally endangered species. The rivers also provide drinking water for more than 100,000 people, and are popular recreational sites. Healthy watersheds assessment methods and data products followed the conventional approaches from other assessments, producing watershed health and vulnerability indices and their respective subindices.
Montana Prairie Wetlands and Intermittent/Ephemeral Streams: Hydrologic Needs Assessment for Healthy Watersheds (PDF) (65 pp, 2 MB) This project was conducted to address the hydrologic needs for healthy watersheds in Montana. Through a two-step process involving the development of hydrology–ecology hypotheses and a case study analysis of one of these hypotheses, it was demonstrated that precautionary limits of hydrologic alteration can be determined for the prairie wetlands of Montana. Twenty hydrology–ecology hypotheses addressing macroinvertebrates, fish, amphibians and birds were identified for individual- and landscape-level wetlands and intermittent/ephemeral steams. One of the hypotheses was then selected for a case study analysis to develop a proof-of-concept model relationship that describes hydrological alteration and ecological condition and supports the development of precautionary limits of hydrologic alteration.
Overview of the Preliminary Healthy Watersheds Assessments Project (PDF) (14 pp, 1 MB)This preliminary assessment provides a “first cut” product nationwide at a small watershed scale, with individual statewide summaries intended to help states and others without Healthy Watersheds Assessments engage in watershed protection planning and prioritizing. The integrated assessment approach involves scoring watersheds with indices of Watershed Health (landscape condition, habitat condition, hydrologic condition, geomorphic condition, biological condition and water quality) and Watershed Vulnerability (risks from land use change, water use and wildfire). In addition to statewide assessment, the preliminary assessment scores and compares each ecoregion’s watersheds. This enables state-level users to be aware of any watershed's condition and vulnerability relative to its ecoregion as well as relative to watersheds across the state.
National Integrated Assessment Reports
Framework for Assessing and Reporting on Ecological Condition (PDF) (142 pp, 1.4MB) This framework was developed by EPA's Science Advisory Board (SAB) as an organizational tool for reporting on information about the condition of ecosystems through an assessment of essential ecological attributes. The framework integrates scientific data and information necessary to answer questions like “How healthy is my watershed?” The Healthy Watersheds Program integrated assessment framework is similar to the SAB framework.
U.S. Forest Service Watershed Condition Framework (PDF) The Watershed Condition Framework establishes a new consistent, comparable, and credible process for improving the health of watersheds on national forests and grasslands. This reconnaissance-level approach classified watershed condition based on 12 indicators that represented ecological, hydrologic and geomorphic functions and processes.
EPA's Recovery Potential Screening (RPS) Tool The RPS website and Tool provide technical assistance for watershed restoration programs to assist in identifying areas with a greater likelihood of restoration success and allow for more targeted use of limited financial resources. This screening tool allows for self-selection of readily available ecological (including watershed natural structure, corridor and shorelands stability, flow and channel dynamics, biotic community integrity, aquatic integrity and ecological history), stressor, and social context indicators. This tool can also be used to set protection priorities.
An Index of Cumulative Disturbance to River Fish Habitats of the Conterminous United States from Landscape Anthropogenic Activities Report This assessment resulted in an index of cumulative anthropogenic disturbance to fish habitats in approximately 2.23 million U.S. river reaches by using spatial data to attribute 15 disturbance variables to the catchments of mapped river reaches and calibrating an index of cumulative disturbance (see national map below) that considered effects originating from both local and upstream catchments. The influence of each variable was adjusted in the index based on the results of multiple linear regression analyses of all variables against percent intolerant fishes at a site (a commonly used biological indicator of habitat condition).

State Integrated Assessment Reports
Minnesota’s Watershed Health Assessment Framework The Watershed Health Assessment Framework (WHAF) provides a comprehensive overview of the ecological health of Minnesota's watersheds. WHAF is based on a whole-system approach, evaluating five components that together provide an integrated view of watershed health: biology, connectivity, geomorphology, hydrology and water quality. Each component is scored for 81 major watersheds of the state using statewide GIS data and component scores are used to calculate a combined Watershed Health Score.
Virginia's Watershed Integrity Model The Virginia Watershed Integrity Model was developed to show the relative value of land as it contributes to watershed or water quality integrity. It combines GIS datasets describing landscape condition, biological condition, riparian/wetland habitat extent, topography and source water protection zones into an overall watershed integrity score for lands throughout the state.
Virginia’s Interactive Stream Assessment Resource (INSTAR) Several state entities collaborated to produce the GIS-based Interactive Stream Assessment Resource (INSTAR) with the purpose of spatially organizing Virginia’s stream and river biological and physical habitat assessment data. INSTAR allows users to access a comprehensive database representing over 2,000 stream and river collections statewide. Data available for mapping and download include a multimetric stream health index for sampled reaches derived from fish, macroinvertebrate, instream habitat and geomorphic measures. Also available is a watershed integrity score for each subwatershed in Virginia derived from a multimetric index of biotic integrity.
California Watershed Assessment Manual The California Watershed Assessment Manual (CWAM) is an example of a statewide effort to develop a framework for conducting holistic watershed assessments and a set of tools to communicate the approach to local watershed groups, local and state agencies and others. The manual outlines data sources and methods for assessing multiple ecological attributes including landscape condition, aquatic habitat extent and condition, fluvial geomorphology, hydrology, water quality and biological condition.
Connecticut's Least Disturbed Watersheds Identification (PDF) (92 pp, 3.5 MB) Connecticut's Department of Environmental Protection used GIS to select 30 least disturbed watersheds in the state based on a variety of characteristics, including land use (e.g., impervious cover, natural land cover), aquatic connectivity and habitat fragmentation and impoundments and withdrawals. The assessment resulted in identification of the best streams for preservation, "streams of hope" for active management and urban streams for mitigation.
Kansas' Least Disturbed Streams Identification (PDF) (73 pp, 4.1 MB) Kansas' Department of Health and Environment conducted an assessment to identify reference high quality streams throughout the state to assist in establishing baseline ecological conditions, developing water quality criteria, identifying impaired waterbodies, performing statewide water quality assessments and formulating restoration goals for environmentally degraded waterbodies. Statistical methods were used to create landscape disturbance indices that relate to stream taxonomic richness and can be used to predict the locations of high quality streams throughout the state.
Oregon's Watershed Assessment Manual (7 pp, 1.17 MB) Oregon's Watershed Enhancement Board prepared a manual for conducting watershed assessments to better understand watershed health, determine how human activities are impacting water quality and habitat and evaluate the effects of land management and use changes over time. The assessment manual addresses hydrology, geomorphology, biological condition, chemical and physical water quality and land use. The assessment results in a watershed condition evaluation that prioritizes sites for protection or restoration actions and provides direction for additional monitoring and assessment activities.
Pennsylvania's Aquatic Community Classification (ACC) and Watershed Conservation Prioritization The Aquatic Community Classification (ACC) project involved systematically identifying stream community and habitat types for freshwater mussels, macroinvertebrates, and fish. Information from the ACC provides baseline data for preserving instream ecological flow conditions, and allows for the prioritization of high quality aquatic habitats for preservation. Multivariate ordination and cluster analysis were used to classify biological communities. This classification was then refined through an expert review and indicator species analysis.
The classification resulted in 13 mussel communities, 11 fish communities, 12 macroinvertebrate communities at the genus level, and eight macroinvertebrate communities at the family level. Watershed, stream channel, and water chemistry data were then used to describe community habitats, and a model of physical stream types was developed to predict community occurrence based on these channel and watershed attributes. Watershed and riparian land cover, mines and point sources, stream crossings and dams were used to assess the condition of each stream reach. Least disturbed streams and watersheds were identified and prioritized for watershed conservation actions, and the results are being used in a variety of conservation and watershed management projects in Pennsylvania.
Local Integrated Assessment Reports
Puget Sound Characterization: The Water Resource Assessments (Water Flow and Water Quality) (PDF) (74 pp, 6.4MB) The Puget Sound Characterization is a set of water and habitat assessments that compare areas within a watershed for restoration and protection value. It is a coarse-scale decision-support tool that provides information for regional, county and watershed-based planning. The assessments cover water resources (both water flow and water quality) and fish and wildlife habitats (in terrestrial, freshwater, and marine nearshore areas) over the entire drainage area of Puget Sound.
The assessments provide a watershed-scale perspective on the relative importance of small watersheds for the protection and restoration of water resources and habitats that is not generally provided by other available tools. Final results can also be analyzed to identify the basis for a small watershed’s relative importance, and to guide potential management strategies for that watershed. The information it provides will allow local and regional governments, and others, to base their decisions regarding land use on a systematic analytic framework that prioritizes specific geographic areas on the landscape as focus areas for protection, restoration and conservation of the region’s natural resources, and that also identifies areas that are likely more suitable for development.
 Sacramento River Basin Report Card and Technical Report: Feather River Watershed (PDF) (205 pp, 26.7MB) The Sacramento River Basin Report card was developed using a stakeholder-driven identification of goals and selection of indicators to evaluate attainment of those goals. The condition of the Sacramento River Basin's subwatersheds was assessed based on the 16 selected indicators (including natural and human processes) and a multimetric index that combines the indicators. Trends over time were also evaluated to determine whether conditions are improving or worsening for the different goals identified by the stakeholders. Results are presented in a report card format for easy interpretation by both the public and decision makers.
 Assessing Ecosystem Values of Watersheds in Southern California: Los Angeles & San Gabriel Rivers Watershed Council The Los Angeles & San Gabriel Rivers Watershed Council performed an assessment of the health of the Arroyo Seco watershed, a tributary to the Los Angeles River. The science-based systematic assessment resulted in a report card designed to reveal the health of the environment and communities in the Southern California region.
The first step in the assessment framework involved the generation of a menu of indicators based on a systematic review of the essential ecological, social and economic attributes of watersheds in the assessment area. Next, those indicators were populated with appropriate measures that reveal the condition of the features of the indicator.
Using the measures, each indicator was then described for its current condition, the trend of its condition over time and the certainty of those descriptions given the measures that were utilized in the assessment. Finally, a report was issued that describes each step of the process as decisions were made, stakeholders were included and the research and assessment was conducted.