2005 NATA: Risk Maps
On this page:
The following maps show the geographic patterns of estimated cancer and non-cancer risks in 2005 from inhalation of air toxics. These maps represent a snapshot of conditions in 2005 and are not reflective of current conditions. EPA developed these maps to inform both national and more localized efforts to collect air toxics information and characterize emissions (e.g., prioritize pollutants/geographic areas of interest for more refined data collection such as monitoring). These maps are for screening purposes only. EPA suggests caution in interpreting the information displayed, as limitations and uncertainties of the assessment will vary from location to location as well as from pollutant to pollutant. In many cases more localized assessments, including monitoring and modeling, may be needed to better characterize local-level risk.
2005 Cancer Risk Maps
- Estimated cancer risk for urban areas - this map and attached list outline core-based statistical areas (CBSA) that have at least one census tract with an estimated lifetime cancer risk greater than 100 in a million. Note that the estimated 100 in a million cancer risk does not apply to the entire CBSA, but rather the specific census tract(s) identified on the map and counted in the list.
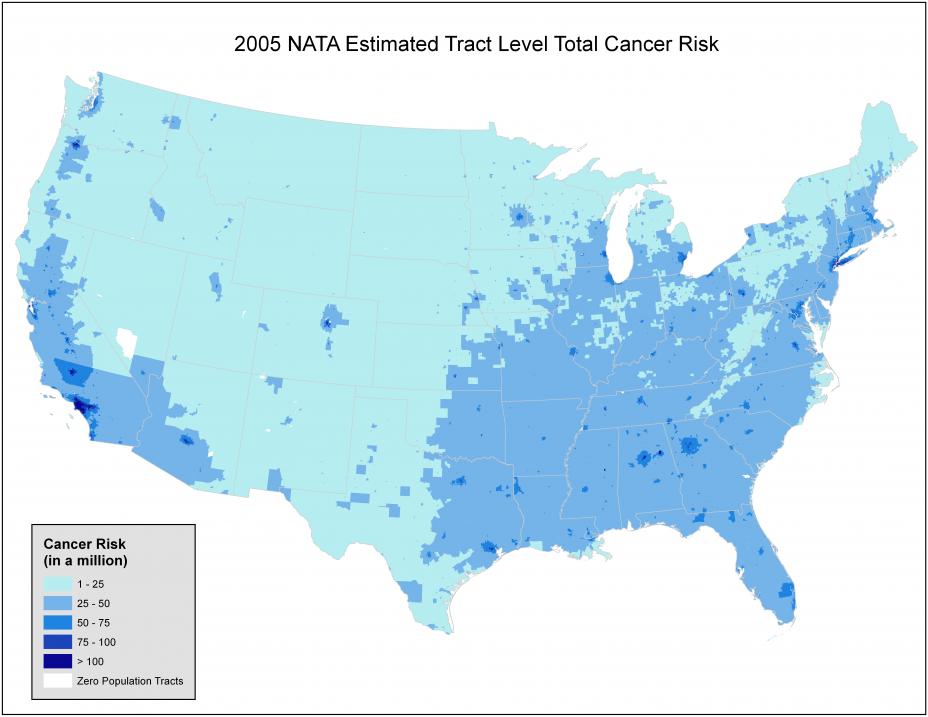
- Estimated cancer risk by census tract (JPG) - this map shows the estimated census tract level of cancer risk, ranging from one in a million to greater than 100 in a million.
2005 Non-cancer Risk Maps
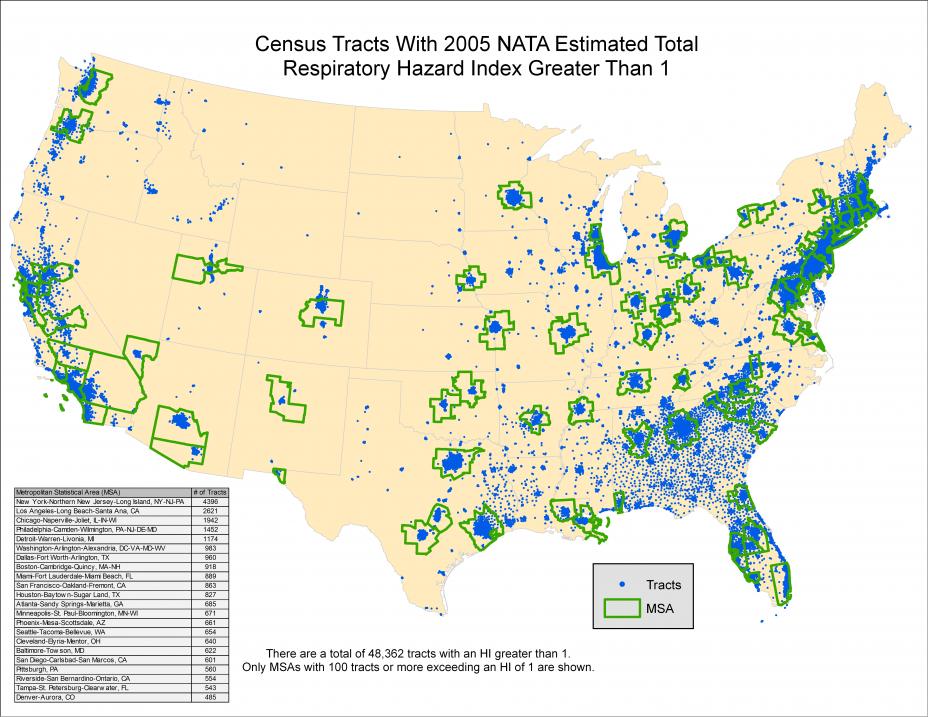
- Estimated respiratory hazards for urban areas (JPG) - this map outlines metropolitan statistical areas (MSA) that have 100 or more census tracts with a respiratory hazard index greater than one.
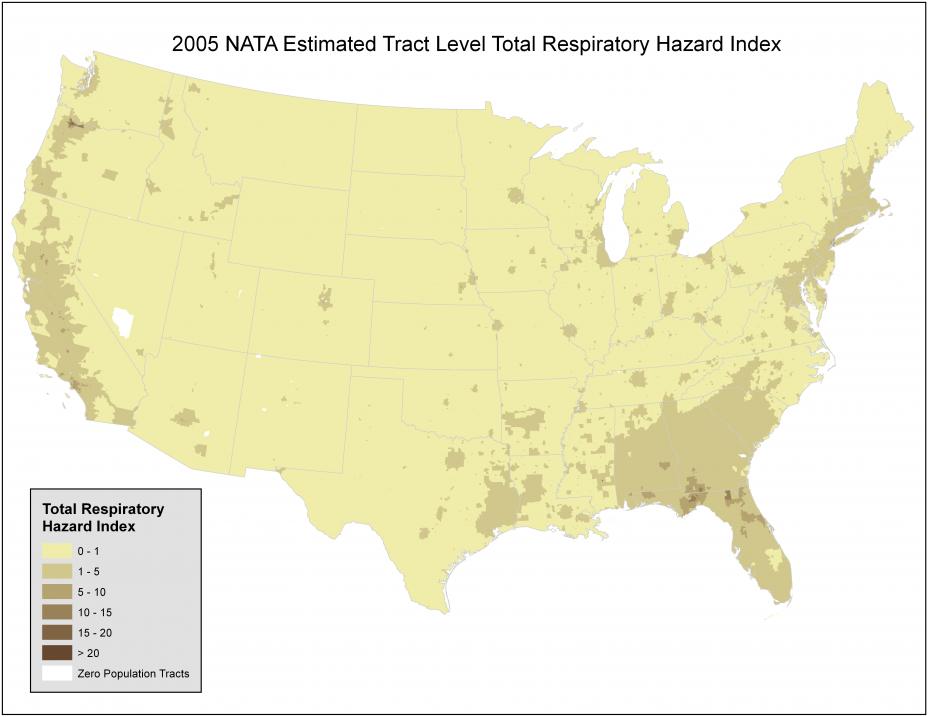
- Estimated respiratory hazards by census tract (JPG) - this map shows the estimated census tract level total respiratory hazard index ranging from zero to more than 20.
2005 Google Earth Risk Maps
These maps show the geographic patterns of estimated cumulative cancer or non-cancer risk due to inhalation of air toxics. EPA developed these maps to inform both national and more localized efforts to collect air toxics information and characterize emissions (e.g., prioritize pollutants/geographic areas of interest for more refined data collection such as monitoring). These files not only present the risk levels for each tract, but also the air toxics contributing to risk levels and their percent contribution. An additional overlay provides the names and locations for each source identified and the toxicity-weighted emissions contributing to 90% of the cancer risk or the emissions contributing to 90% of the total mass for that tract.
The file, Instructions for Downloading and Using Google Earth Maps, provides step-by-step instructions for accessing the data in these interactive Google Earth maps.
Note: These zipped KMZ files must be saved and the contents extracted before opening. Please note that file sizes range from .06 MB to 22 MB.