Upper Midwest Ecoregion - National Lakes Assessment 2012 Results
Key Results
A total of 26,307 lakes in the Upper Midwest ecoregion are represented in the National Lakes Assessment (NLA). Of these lakes, about 97% are natural and 3% are man-made.
The NLA uses trophic state as an important indicator of lake condition and assesses the extent of key stressors in the nation’s lakes.
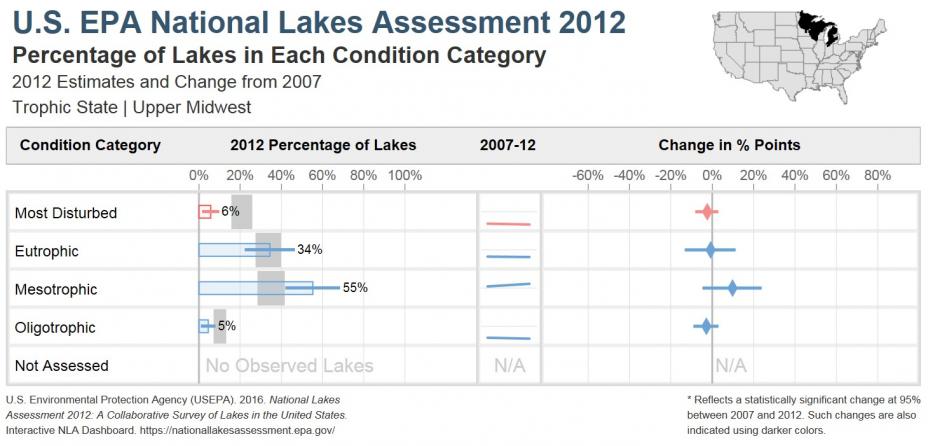
- In the Upper Midwest, 6% of lakes are rated as most disturbed based on trophic state, 34% are eutrophic, 55% are mesotrophic, and 5% are oligotrophic.
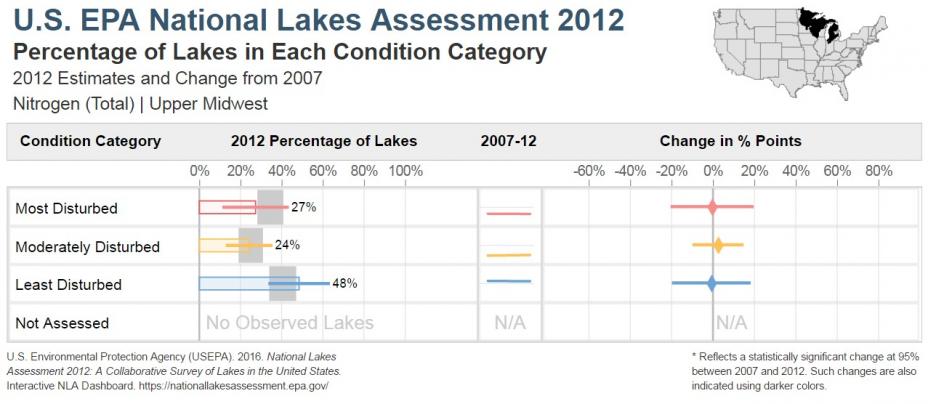
- The most widespread stressors assessed are nitrogen and lake habitat complexity (both 27% of lakes), and riparian vegetation cover (25%).
Trophic State

Indicator with the Highest Percentage of Lakes in the Most Disturbed Condition: Nitrogen

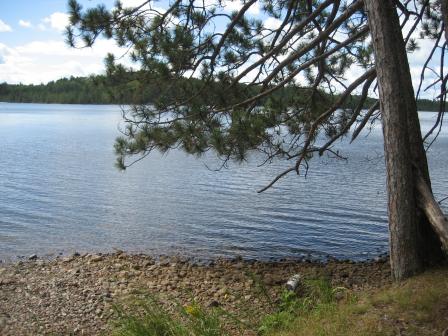
 Big Gibson Lake in Wisconsin. Photo: Sarah Lehmann, EPA.
Human Use Condition
Cyanobacteria is one of three algal toxin related indicators presented in the NLA (see also chlorophyll a and microcystins). It serves as a proxy for the presence of algal toxins.
- Based on cyanobacteria cell counts, 6% of lakes in the Upper Midwest are in the most disturbed condition (i.e., pose a high risk of exposure to algal toxins).
Change from 2007 (for lakes >4 hectares)*
- For the Upper Midwest, the NLA reports a 12% decrease in the proportion of lakes in most disturbed condition between 2007 and 2012 based on the lake drawdown exposure indicator.
To access more indicator graphics please visit the interactive NLA Dashboard.
* The change analysis is based on information from two points in time – 2007 and 2012. The change in condition analysis only considers lakes 4 hectares and larger because smaller lakes were not sampled in 2007.
