Patient Exposure and the Air Quality Index
On this page:
- Should I recommend that my patients reduce their exposure to particle pollution?
- What is the Air Quality Index (AQI)?
- Where can I find daily air quality reports?
- What can I advise my patients to do when air quality is unhealthy?
- How can my patients reduce particle pollution exposure near roadways?
- How effective are air quality notifications in reducing potentially adverse exposures?
- What education materials are available?
Should I recommend that my patients reduce their exposure to particle pollution?
Yes. All people should be educated about the health effects from unhealthy levels of particle pollution and how to reduce exposure.
Patients more likely to be affected by particle pollution exposure that will benefit the most from exposure-reduction measures are:
- People with heart or lung diseases.
- People with diabetes.
- Older adults
 older adults In many studies, older adults are defined as ages 65 years and older due to age definitions provided in health datasets such as the Medicare database. In terms of increased risk from air pollution, there is not a specific age at which someone is considered “older” because people age at different rates. As a person ages, there is greater susceptibility to environmental hazards due to a number of factors, including higher prevalence of pre-existing respiratory and cardiovascular disease, as well as the gradual decline in physiological defenses that occur as part of the aging process. .
 - Children (less than 18 years old).
In your patient education, you should encourage awareness of daily air quality, which can be found in weather broadcasts, on websites, or through the use of notifications that provide it via email, or an app (airnow.gov has forecasts as well as links to the email notification and app). Provide recommendations for reducing exposure by basing activity on the air quality and on the patient’s level of risk. A list of such recommendations is provided in the next section (What is the Air Quality Index (AQI)? – (Figure 9.) of this course. In addition, the Clinical Scenarios and Frequent Questions sections contain clinically relevant suggestions for when and how to advise patients to reduce their exposure or increase medication usage.
What is the Air Quality Index (AQI)?
The AQI is a nationally uniform color-coded index for reporting and forecasting daily air quality. It is used to report on the most common ambient air pollutants that are regulated under the Clean Air Act: ground-level ozone, particle pollution (PM10 and PM2.5), carbon monoxide (CO), nitrogen dioxide (NO2), and sulfur dioxide (SO2). The AQI tells the public how clean or polluted the air is and how to avoid health effects associated with poor air quality.
The AQI focuses on health effects that may be experienced within a few hours or days after breathing polluted air and uses a normalized scale from 0 to 500; the higher the AQI value, the greater the level of pollution and the greater the health concern. An AQI value of 100 generally corresponds to the level of the short-term National Ambient Air Quality Standard ![]() National Ambient Air Quality Standard (NAAQS) The Clean Air Act requires EPA to set National Ambient Air Quality Standards for pollutants considered harmful to public health and the environment.The EPA has set National Ambient Air Quality Standards for six criteria pollutants: sulfur dioxide (S02), particulates (PM2.5/PM10), nitrogen oxides (NOx), carbon monoxide (CO), ozone (O3), and lead (Pb). Periodically, the standards are reviewed and may be revised. for the pollutant. AQI values at and below 100 are generally considered to be satisfactory. When AQI values are above 100, air quality is considered to be unhealthy, at first for members of populations at greatest risk of a health effect, then for the entire population as AQI values get higher (greater than 150).
National Ambient Air Quality Standard (NAAQS) The Clean Air Act requires EPA to set National Ambient Air Quality Standards for pollutants considered harmful to public health and the environment.The EPA has set National Ambient Air Quality Standards for six criteria pollutants: sulfur dioxide (S02), particulates (PM2.5/PM10), nitrogen oxides (NOx), carbon monoxide (CO), ozone (O3), and lead (Pb). Periodically, the standards are reviewed and may be revised. for the pollutant. AQI values at and below 100 are generally considered to be satisfactory. When AQI values are above 100, air quality is considered to be unhealthy, at first for members of populations at greatest risk of a health effect, then for the entire population as AQI values get higher (greater than 150).
The AQI is divided into six categories that correspond to different levels of health concern. The breakpoints between these categories are selected based on a review of the health effects evidence. For particle pollution, the evidence largely consists of epidemiology studies that evaluate the morbidity and mortality effects of acute and chronic exposures to particle pollution.
For particle pollution, epidemiological studies show little evidence of a population threshold, or level below which particle pollution-associated effects are unlikely to occur. Even serious effects, such as mortality, can occur at low levels. Some individuals are much more sensitive to air pollution than others. Checking the AQI each day will help these people notice at what levels they begin to experience effects. The levels of health concern listed below are general guidelines to be used as a reference so that people can figure out their own sensitivity to air pollution.
- Good: Air quality is good and poses little or no risk.
- Moderate: Air quality is acceptable; however, there may be some health concern for a small number of unusually sensitive people. While EPA cannot identify these people, studies indicate that there are people who experience health effects when air quality is in the moderate range.
- Unhealthy for Sensitive Groups: When air quality is in this range, people who are in sensitive groups, whether the increased risk is due to medical conditions, exposure conditions, or innate susceptibility, may experience health effects when engaged in outdoor activities. However, exposures to ambient concentrations in this range are not likely to result in effects in the general population. For particle pollution, the sensitive groups include people with heart and lung disease, older adults, children, people with diabetes, and people of lower SESlower socio-econonmic status (SES) A composite measure that is often comprised of a number of indicators, including economic status measured by income, social status measured by education, and work status measured by occupation. Each of these linked factors can influence a population's susceptibility to particle pollution-related health effects (Dutton and Levine, 1989)..
- Unhealthy: When air quality is in this range, everyone who is active outdoors may experience effects. Members of sensitive groups are likely to experience more serious effects.
- Very Unhealthy: When air quality is in this range, it is expected that there will be widespread effects among the general population and more serious effects in members of sensitive groups.
- Hazardous: Air quality in this range triggers health warnings of emergency conditions by media outlets. The entire population is more likely to be affected by serious health effects.
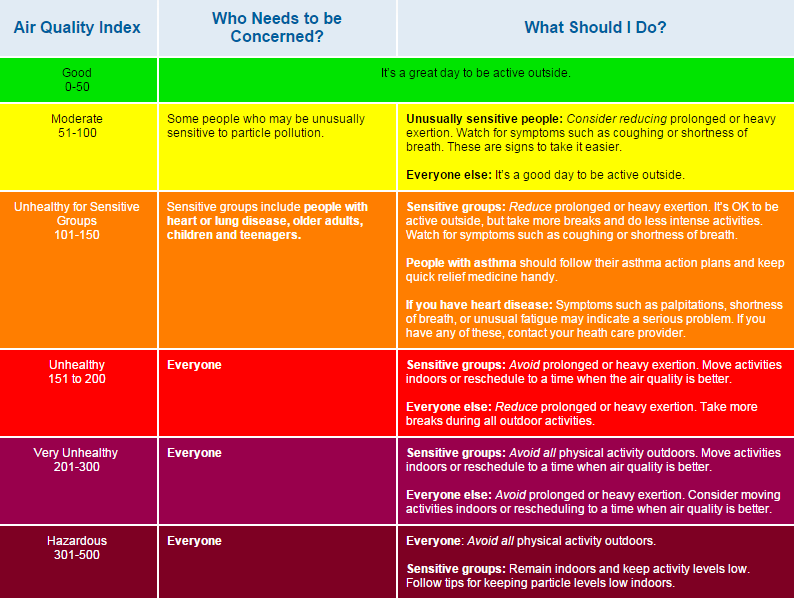
The AQI levels of health concern correlate with pollutant-specific health and cautionary statements that suggest simple measures people can take to reduce their exposure to air pollution (Figure 9). For example, when the AQI value for particle pollution is between 101 and 150, or Code Orange, air quality is considered “unhealthy for sensitive groups.” In this range, people with heart or lung disease, older adults, children, people with diabetes, and people of lower SES are advised to reduce prolonged or heavy exertion.
For most adults, activities that involve moderate physical exertion (i.e., minute ventilation rates ranging from 25 to 45 liters per minute) include climbing stairs, playing tennis or baseball, simple garden or construction work, and light jogging, cycling, or hiking. Activities that involve heavy physical exertion, with minute ventilation rates greater than 45 liters per minute, typically include playing basketball or soccer, chopping wood, heavy manual labor, and vigorous running, cycling, or hiking. Because fitness levels vary widely among individuals, what is moderate exertion for one person may be heavy exertion for another. No matter how fit a person is, cutting back on the level and/or duration of exertion when particle levels are unhealthy will reduce the inhaled dose and help protect against the harmful effects of particle pollution.
Where can I find daily air quality reports?
In many areas, the local media—newspapers, television, and radio—provide air quality reports telling the public when pollution levels are predicted to be unhealthy. These reports generally appear with the weather forecast. Some national media, such as USA Today, The Weather Channel, and CNN, also provide daily air quality reports.
Air quality forecasts and real-time air quality information can be found on EPA’s AirNow Website. Next-day air quality forecasts for more than 400 cities across the country are posted daily by 4:30 p.m.
An AirNow App provides real-time air quality information that you can use to protect your health while planning your day.
People in many areas can also sign up to receive e-mail or text notifications about air quality through a free service called EnviroFlash, which is provided by state or local environmental agencies in conjunction with EPA. Each user can select the AQI level at which he or she wants to be notified (e.g., unhealthy for sensitive groups) and whether to receive forecasts and/or real-time air quality levels. When the AQI is forecast to be at or above that level, or reaches that level in near real-time, notification is sent. The message includes the same air quality information that the local radio or television stations provide, plus suggested safety measures when levels are unhealthy. More information about EnviroFlash can be found at the AirNow Website.
What can I advise my patients to do when the air quality is unhealthy?
Your patients can reduce their exposures simply by taking it easier when particle pollution levels are at unhealthy levels. They can reduce their exposure by reducing the time they spend being active outdoors (e.g., gardening 30 minutes instead of an hour), by reducing the intensity of outdoor activity (e.g., jogging instead of running), or by being active outdoors when air quality is better. The intake dose of pollution inhaled is equal to the product of the ambient concentration, ventilation rate (per minute) and duration of the exposure (Intake Dose = ambient concentration x minute ventilation rate x time in minutes). Note that the intake dose of particles is greater than the deposited dose in the respiratory tract since a portion of inhaled particles are exhaled. The chances of being affected by unhealthy levels of particle pollution increase the longer a person is active outdoors and the more strenuous the activity.
When particle pollution levels are elevated, your patients with respiratory disease may not be able to breathe as deeply or as vigorously as normal and may experience coughing and chest discomfort, wheezing, shortness of breath, and unusual fatigue. These symptoms indicate they should reduce exposure to particle pollution and follow your advice. For example, people with asthma should carefully follow their asthma action plans when particle pollution levels are high. In the “Patient Education Tools” module of this course, you can find a fact sheet that can help you provide advice to asthma patients.
For people with heart disease, exposure to high particle pollution levels can cause serious problems in a short period of time—even heart attacks—with no warning signs. Thus, these patients should not assume that they are safe just because they do not have symptoms. Symptoms such as chest pain or tightness, palpitations, shortness of breath, or unusual fatigue may indicate a serious problem. The “Patient Education Tools” module contains a fact sheet that can help you provide advice to patients with heart disease.
While healthy children do not usually experience serious health effects from short-term exposures to particle pollution, evidence indicates that long-term exposures can affect lung function growth. Children are more likely to be exposed than adults because they are more active outdoors. The “Patient Education Tools” module contains Air Quality and Outdoor Activity Guidance for Schools that can help you provide advice to parents of children.
How can my patients reduce particle pollution exposure near roadways?
There are two simple ways your patients can reduce exposures from particle pollution on roadways:
- Walkers, runners, and bikers can reduce their particle pollution exposure by planning times and routes that avoid busy roads.
- Drivers can reduce exposure to particle pollution by keeping the vehicle ventilation setting on "recirculate" when driving on busy roads (Hudda et. al, 2013; Ding et. al, 2015).
How effective are air quality notifications in reducing potentially adverse exposures?
For air quality advisories to have a positive effect on public health, they must be widely available and well-understood. Evidence indicates the air quality alerts are helpful and advocacy from health care professionals is powerful.
In 2005, six states (Colorado, Florida, Indiana, Kansas, Massachusetts, and Wisconsin) included questions about how environmental factors and the AQI affect people’s activity levels in the Behavioral Risk Factor and Surveillance System (BRFSS). In Kansas, this survey showed that when a health care professional advised people to change their outdoor activity level when air quality is unhealthy, both awareness of the AQI and behavior change increased. Specifically, people were almost four times as likely to change outdoor activity levels if they were advised by a health care professional. However, only a small percentage of people in groups at increased risk from particle pollution (16 percent of adults with asthma and 5 percent of adults 65 years and older) were advised to pay attention to the AQI by a health care professional (Kansas Department of Health and Environment, 2006).
An analysis of the six states’ data in the BRFSS indicated that those that had ever received a health professional’s advice about the AQI were two to three times more likely to report a change in outdoor activity based on an air quality alert. Specifically, those with lifetime asthma were almost twice as likely (from 31 percent to 57 percent) and those without asthma more than three times as likely (from 16 percent to 51 percent) to report a change in outdoor activity based on an air quality alert (Wen et al., 2009).
The AQI advisories for particle pollution have not been in place as long as those for ozone, so, currently, there is no evidence of reductions in particle pollution exposures, morbidity, or mortality due to averting behaviors in response to particle pollution advisories. However, we can infer that averting behavior, similar to that reported in response to ozone advisories discussed below, is likely to occur as the public becomes educated about the risks associated with particle pollution exposures and how to reduce them.
Studies focusing on ozone provide evidence indicating the importance of air quality alerts in altering individual behavior that may be applicable to particle pollution exposures. In a Southern California study, attendance at two outdoor facilities (i.e., a zoo and an observatory) was reduced by 6-13 percent on days when ozone alerts were announced, with greater decreases observed among children and older adults (Neidell, 2009).
Several studies show evidence of individual-averting behaviors in response to air quality advisories, especially for populations potentially at increased risk of a particle pollution-related health effect, such as children, older adults, and people with asthma.
An activity diary study in 35 U.S. cities (Figure 10) reported reduced time spent outdoors in reponse to air quality alerts. Children with asthma who spent at least some time outdoors reduced their total time spent outdoors by an average of 30 minutes on a “code red” ozone day (AQI category is Unhealthy) relative to a code green, yellow, or orange day. However, the authors noted that there was appreciable variation in both the overall amount of time spent outdoors and the reduction in outdoor time on high ozone days among children with asthma, with the reductions seen in children whose parents reported that they were sensitive to air pollution.
 Figure 10. Activity Diaries for Air Pollution Sensitive vs. Not Sensitive Asthmatic Children (Reprinted with permission of the author. Mansfield et al. 2006)
Figure 11, reproduced from Neidell (2009), shows covariate-adjusted asthma hospital admissions as a function of daily maximum one-hour ozone concentration for all days (gray line) and days when no ozone alert was issued (black line).

Figure 11. Adjusted asthma hospital admissions (HA) by age on lagged ozone by alert status, ages 5-19. Neidell, M. “Information, Avoidance Behavior, and Health: The Effect of Ozone on Asthma Hospitalizations.” Journal of Human Resources 44.2 (2009): 450-478. © 2009 by the Board of Regents of the University of Wisconsin System. Reproduced by the permission of the University of Wisconsin Press.
For children aged 5-19, hospital admissions were higher on high-ozone days when no alert was issued, especially on days with ozone concentrations above 150 ppb. The concentration-response curves for all days and days with no alert diverge at measured ozone concentrations between 100 and 150 ppb because alerts begin to be issued more frequently in this range. This suggests that in the absence of information that would enable averting behavior, children experience higher ozone exposure and, subsequently, a greater number of asthma hospital admissions than on alert days with similar ozone concentrations. The lower rate of admissions observed when alert days were included in the analysis suggests that averting behavior reduced ozone exposure and asthma hospital admissions.
What education materials are available?
The EPA designed a colorful poster (Figure 12), which you can use in patient waiting areas or exam rooms to educate your patients about the health effects of outdoor air pollution, including particle pollution, on the respiratory and cardiovascular systems. See the “Patient Education Tools” section of the course for a printable file of the poster. “Patient Education Tools” also has downloadable fact sheets for your office to print for patients with heart disease or asthma. There are other air quality and outdoor activity education materials, including those on how to limit exposure to smoke from fires.
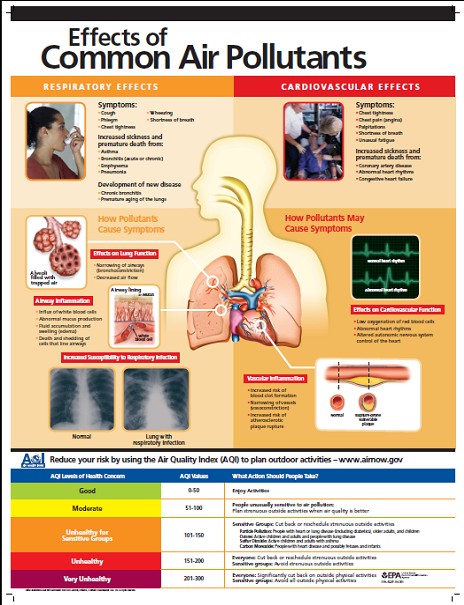 Figure 12: Effects of Common Air Pollutants
You can advise your patients to visit the AirNow Website to find air quality forecasts and real-time air quality information, to learn about the health effects of particle pollution and other pollutants, and to obtain information about the AQI.