Environmental Benefits
Since the inception of the RAD Program, partners have successfully reduced emissions of ozone-depleting substances (ODS) and greenhouse gases (GHGs). Partners have also reduced energy consumption, increased the recycling of durable goods, and ensured the proper handling of hazardous substances. Annual environmental benefits achieved by RAD partners are summarized in the table below.
More information on these environmental benefits is provided below.
- Stratospheric Ozone Benefits (Bar Graph)
- Climate Benefits (Bar Graph)
- Energy Savings
- Other Environmental Benefits
| 2007 | 2008 | 2009 | 2010 | 2011a | 2012 | 2013 | 2014 | |
|---|---|---|---|---|---|---|---|---|
| Number of Partners and Affiliates | 9 | 16 | 23 | 34 | 44 | 50 | 54 | 54 |
| Number of Units Processed | ||||||||
| Refrigerators | 166,557 | 418,223 | 644,751 | 669,523 | 815,595 | 794,113 | 811,458 | 837,364 |
| Stand-alone freezers | 9,316 | 81,592 | 35,356 | 63,387 | 82,367 | 84,063 | 89,905 | 91,449 |
| Window air conditioners | 290 | 5,608 | 2,136 | 2,376 | 5,253 | 7,321 | 7,474 | 7,113 |
| Dehumidifiers | 0 | 533 | 55 | 156 | 878 | 1,180 | 2,054 | 2,158 |
| Ozone Benefits (ODP-weighted tons avoided)a | 89b | 153 | 148 | 151 | 217 | 274 | 263 | 207 |
| Climate Benefits | ||||||||
| Emissions avoided by recovery of refrigerant and foam-blowing agent (MMTCO2e)b | 0.6b | 1.2 | 1.3 | 1.3 | 1.7 | 2.2 | 2.1 | 1.7 |
| Emissions avoided by increased recycling of durable goods | <0.1 | 0.1 | 0.1 | 0.1 | 0.2 | 0.1 | 0.1 | 0.1 |
| Reduced energy consumption through early appliance retirement (MMTCO2e)b | 1.1 | 1.5 | 1.9 | 2.2 | 2.3 | 1.9 | 1.9 | 1.7 |
| Durable Materials Recycled (million lbs.) | 27 | 87 | 110 | 118 | 147 | 148 | 150 | 155 |
| Hazardous Substances Properly Treated | ||||||||
| Used Oil (thousand gal.) | 31c | 164c | 46 | 43 | 59 | 77 | 74 | 76 |
| Other Hazardous Components (thousand components) | NAd | NAd | NAd | 86 | 95 | 47 | 55 | 60 |
a Due to corrections in partner data reporting, the benefits shown here differ from those presented in the Annual Report.
b ODP = ozone depletion potential.
c MMTCO2eq = Million metric tons of carbon dioxide equivalent.
d NA= not available; hazardous components were reported in pounds prior to 2010. Reported quantities were 1,500 lbs. in 2007, 14,090 lbs. in 2008, and 215,200 lbs. in 2009.
Stratospheric Ozone Benefits
RAD partners reduce emissions of ODS by recovering and reclaiming or destroying ODS refrigerant (CFC-12, HCFC-22) and foam-blowing agent (CFC-11, HCFC-141b) contained in household appliances. The quantity of refrigerant and foam-blowing agent recovered and properly handled by RAD partners in 2007-2014 is shown below.
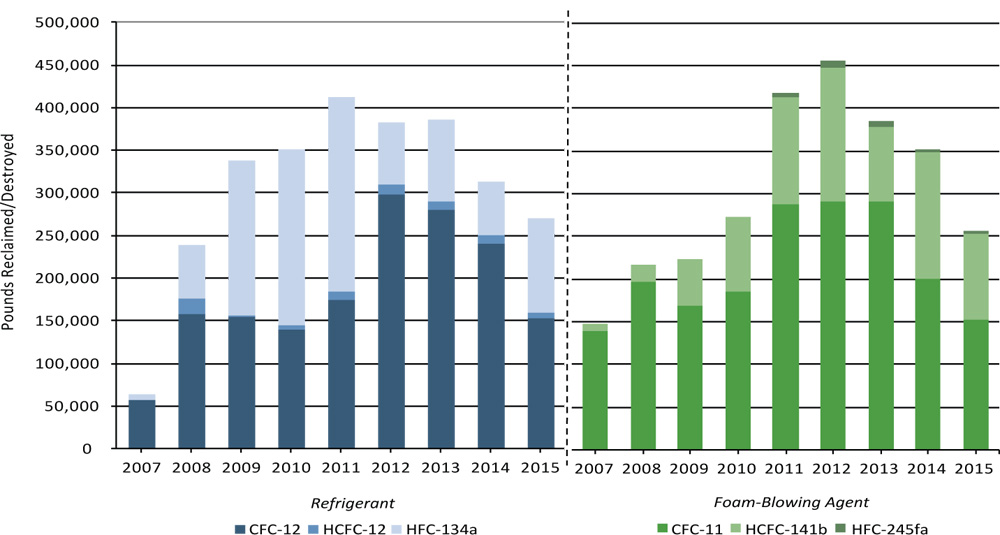 * No ozone benefits are associated with the reclamation/destruction of HFC-134a refrigerant or HFC-245fa foam-blowing agent, although significant climate benefits are realized (see section below).
By avoiding the release of CFC and HCFC refrigerant and foam-blowing agent, an estimated 1,500 ozone depletion potential (ODP)-weighted tons of emissions have been avoided since program inception. The majority of refrigerant and foam-blowing agents recovered since 2007 were CFCs. This is the result of RAD partners’ efforts to target older, inefficient units. In the coming years, more HFC units will be retired. Proper handling of HFC refrigerants and blowing agents at end-of-life will reduce GHG emissions.
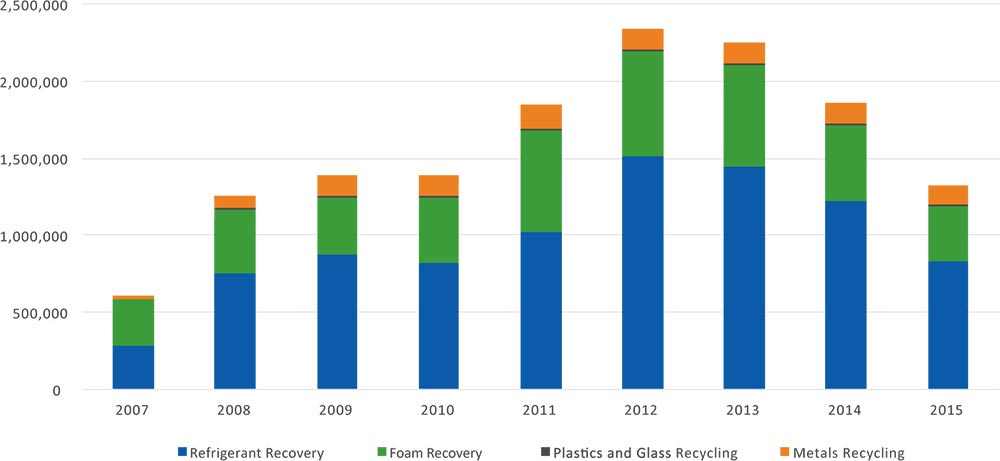
Climate Benefits
The recovery of CFC, HCFC, and HFC refrigerants and foam-blowing agents from household appliances results in significant climate benefits, as these substances are all potent GHGs. In addition, the recycling of durable materials from appliances results in lower emissions of carbon dioxide (CO2) associated with the generation of electricity, which would have otherwise been needed to produce virgin materials. The total GHG emissions avoided through refrigerant recovery, foam recovery, and durable goods recycling by RAD partners in 2007-2014 are shown below.
Energy Savings
For utilities, appliance recycling programs can be an important component of a successful demand side management (DSM) program. Replacing old, inefficient refrigerant-containing appliances reduces the amount of electricity needed to power them and, therefore, the amount of CO2 emissions released. By collecting old, inefficient appliances for proper disposal, RAD’s utility partners have generated the benefits summarized in the table below. As shown, the energy savings realized by RAD utility partners, as well as the associated climate benefits and consumer savings, have increased steadily over the last eight years.
| 2007 | 2008 | 2009 | 2010 | 2011a | 2012 | 2013 | 2014 | |
|---|---|---|---|---|---|---|---|---|
| Number of Units Retired Prematurely | ||||||||
| Refrigerators | 166,557 | 214,373 | 250,314 | 254,962 | 273,520 | 294,019 | 310,620 | 334,115 |
| Stand-alone freezers | 9,316 | 12,530 | 6,703 | 44,434 | 48,614 | 78,705 | 78,967 | 59,154 |
| Window air conditioners | 290 | 1,407 | 1,186 | 1,223 | 1,712 | 3,062 | 3,221 | 3,339 |
| Dehumidifiers | 0 | 533 | 49 | 21 | 29 | 264 | 783 | 1,295 |
| Energy Saved (billion kWh)b | 1.7 | 2.4 | 2.7 | 3.0 | 3.2 | 2.6 | 2.7 | 2.4 |
| Climate Benefits GHG emissions avoided (MMTCO2eq)c | 1.1 | 1.5 | 1.9 | 2.2 | 2.3 | 1.9 | 1.9 | 1.7 |
| Consumer Savings (million $) | $146 | $283 | $320 | $372 | $424 | $313 | $319 | $335 |
a Due to corrections in partner data reporting, the benefits shown here differ from those presented in the Annual Report.
b kWh = kilowatt hours.
c MMTCO2eq = million metric tons of carbon dioxide equivalent.
Other Environmental Benefits
RAD partners further protect the environment by keeping recyclable materials—such as glass, plastics, and metals—out of landfills and by ensuring the proper handling of hazardous wastes—namely used oil from compressors, polychlorinated biphenyls (PCBs) from capacitors, and mercury from thermostatic switches. As shown below, RAD partners have recovered significant quantities of these materials.
| 2007 | 2008 | 2009 | 2010 | 2011 | 2012 | 2013 | 2014 | |
|---|---|---|---|---|---|---|---|---|
| Durable Materials Recycled (million lbs.) | ||||||||
| Ferrous metals | 23 | 73 | 78 | 85 | 107 | 117 | 119 | 123 |
| Non-ferrous metals | 1 | 2 | 16 | 16 | 18 | 6 | 6 | 6 |
| Plastic | 3 | 10 | 14 | 15 | 19 | 22 | 21 | 23 |
| Glass | <1 | 2 | 2 | 2 | 3 | 3 | 3 | 4 |
| Proper Treatment of Hazardous Substances | ||||||||
| Used oil (thousand gal.) | 31 | 164 | 46 | 43 | 59 | 77 | 74 | 76 |
| PCB-containing capacitors (thousand capacitors) | NAb | NAb | NAb | 45 | 50 | 44 | 42 | 43 |
| Mercury-containing components (thousand components) | NAc | NAc | NAc | 41 | 46 | 4 | 13 | 18 |
a Due to corrections in partner data reporting, the benefits shown here differ from those presented in the RAD Annual Report.
b NA= not available; PCB-containing capacitors were reported in pounds prior to 2010. Reported quantities were 1,400 lbs. in 2007, 8,200 lbs. in 2008, and 213,500 lbs. in 2009.
c NA= not available; mercury-containing components were reported in pounds prior to 2010. Reported quantities were 100 lbs. in 2007, 5,900 lbs. in 2008, and 1,600 lbs. in 2009.
Outlook for the Future
Looking ahead, the RAD Program will continue to expand its membership and increase the environmental benefits achieved each year. The RAD Program is gaining momentum as industry and appliance owners alike learn about the importance of proper disposal and do what they can to address the problem.