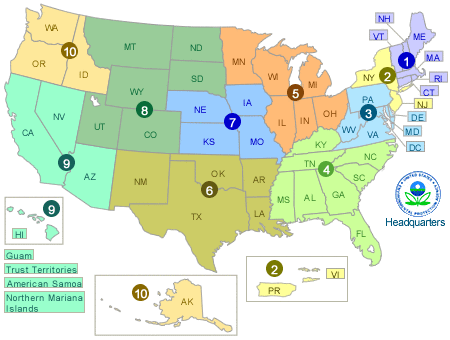
EPA developed charts comparing authorization progress of the states in each region for all of the more stringent core program final rules promulgated after July 1, 1990. Additionally, EPA developed a regional authorization comparison chart, a chart comparing the percentage of authorization for these core rules in each states, a list of recent core program rules and the authorization status by state for each of the recent core program rules.
- Region 1 Measure Comparison (PDF)(1 pg, 254 K)
- Region 2 Measure Comparison (PDF)(1 pg, 253 K)
- Region 3 Measure Comparison (PDF)(1 pg, 254 K)
- Region 4 Measure Comparison (PDF)(1 pg, 256 K)
- Region 5 Measure Comparison (PDF)(1 pg, 254 K)
- Region 6 Measure Comparison (PDF)(1 pg, 255 K)
- Region 7 Measure Comparison (PDF)(1 pg, 253 K)
- Region 8 Measure Comparison (PDF)(1 pg, 255 K)
- Region 9 Measure Comparison (PDF)(1 pg, 254 K)
- Region 10 Measure Comparison (PDF)(1 pg, 254 K)
- Chart of Regional Authorization Comparison (PDF)(1 pg, 255 K)
- Chart of Authorization Comparison for States (PDF)(1 pg, 252 K)
- Core Program Rules Authorization Status Table (PDF)(52 pp, 394 K)
- Core Program Rule List (PDF)(6 pp, 124 K)