SmartWay Trends, Indicators, and Partner Statistics (TIPS)
 SmartWay Trends, Indicators, and Partner Statistics (TIPS) is your source for at-a-glance data about freight transportation and SmartWay Partners.
-
Latest TIPS charts
- About TIPS
Latest TIPS Charts
The charts below show miles per gallon, average payload, and percent of urban operations for various truck carrier categories using 2018 SmartWay Partner data. Click each image to enlarge to full size.
Download: Data tables for 2018 Truck Carrier Charts (XLS)(30 K, February 2020)
Class 8B Truck Carrier Data
Click images to enlarge to full size.
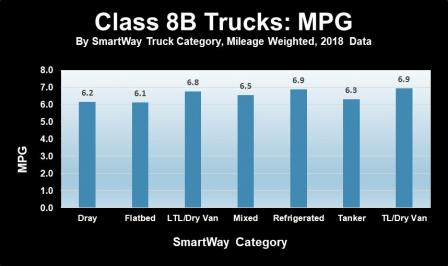 Class 8B Miles Per Gallon: SmartWay data from 2018 (Submitted via the SmartWay 2019 Truck Carrier Tool) shows class 8B mileage-weighted Miles Per Gallon (MPG) data for the most populous SmartWay carrier categories: Truckload Dry Van, Less-Than-Truckload Dry Van, Refrigerated, Tanker, Flatbed, Dray, and Mixed (fleets that are not predominantly one of the other types).
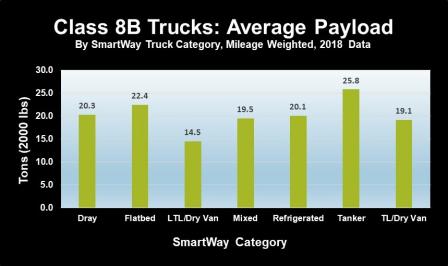
Class 8B Average Payload: SmartWay data from 2018 (Submitted via the SmartWay 2019 Truck Carrier Tool) shows class 8B mileage-weighted Average Payload data for the most populous SmartWay carrier categories: Truckload Dry Van, Less-Than-Truckload Dry Van, Refrigerated, Tanker, Flatbed, Dray and Mixed (fleets that are not predominantly one of the other types).
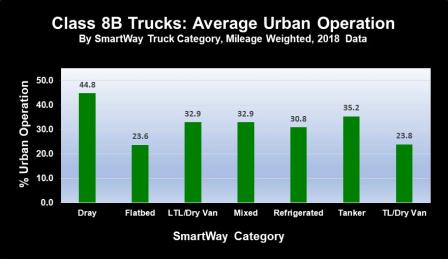
Class 8B Percent of Urban Operations: SmartWay data from 2018 (Submitted via the SmartWay 2019 Truck Carrier Tool) shows class 8B mileage-weighted Percent of Urban Operation data for the most populous SmartWay carrier categories: Truckload Dry Van, Less-Than-Truckload Dry Van, Refrigerated, Tanker, Flatbed, Dray, and Mixed (fleets that are not predominantly one of the other types).
Class 8A Truck Carrier Data
Click images to enlarge to full size.
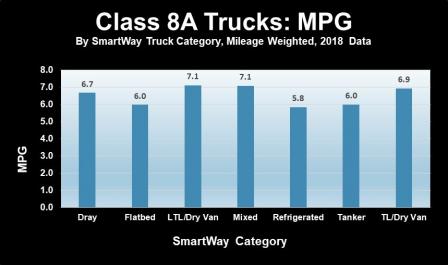
Class 8A Miles per Gallon: SmartWay data from 2018 (Submitted via the SmartWay 2019 Truck Carrier Tool) shows class 8A mileage-weighted Miles Per Gallon (MPG) data for the most populous SmartWay carrier categories: Truckload Dry Van, Less-Than-Truckload Dry Van, Refrigerated, Tanker, Flatbed, Dray, and Mixed (fleets that are not predominantly one of the other types).
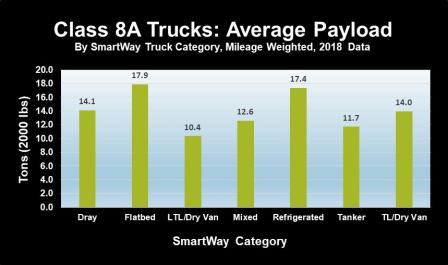
Class 8A Average Payload: SmartWay data from 2018 (Submitted via the SmartWay 2019 Truck Carrier Tool) shows class 8A mileage-weighted Average Payload data for the most populous SmartWay carrier categories: Truckload Dry Van, Less-Than-Truckload Dry Van, Refrigerated, Tanker, Flatbed, Dray and Mixed (fleets that are not predominantly one of the other types).
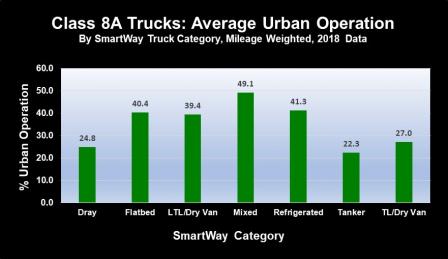
Class 8A Percent of Urban Operations: SmartWay data from 2018 (Submitted via the SmartWay 2019 Truck Carrier Tool) shows class 8A mileage-weighted Percent of Urban Operation data for the most populous SmartWay carrier categories: Truckload Dry Van, Less-Than-Truckload Dry Van, Refrigerated, Tanker, Flatbed, Dray, and Mixed (fleets that are not predominantly one of the other types).
Class 7 Truck Carrier Data
Click images to enlarge to full size.
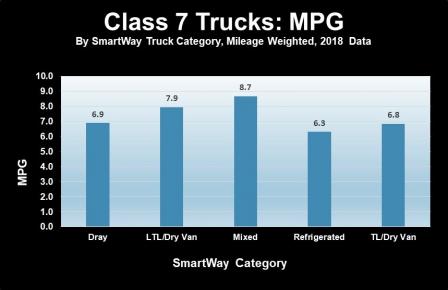 Class 7 Miles per Gallon: SmartWay data from 2018 (Submitted via the SmartWay 2019 Truck Carrier Tool) shows class 7 mileage weighted Miles Per Gallon (MPG) data for the most populous SmartWay carrier categories: Truckload Dry Van, Less-Than-Truckload Dry Van, Refrigerated, Dray and Mixed (fleets that are not predominantly one of the other types).
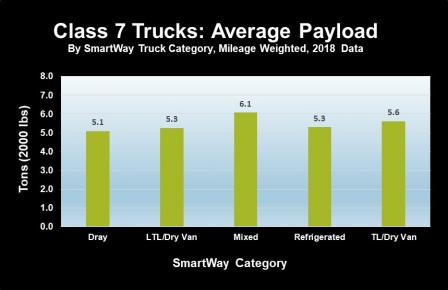 Class 7 Average Payload: SmartWay data from 2018 (Submitted via the SmartWay 2019 Truck Carrier Tool) shows class 7 mileage weighted Average Payload data for the most populous SmartWay carrier categories: Truckload Dry Van, Less-Than-Truckload Dry Van, Refrigerated, Dray and Mixed (fleets that are not predominantly one of the other types).
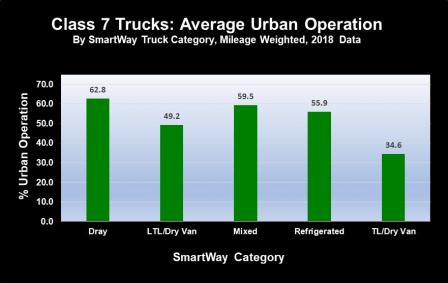 Class 7 Percent of Urban Operations: SmartWay data from 2018 (Submitted via the SmartWay 2019 Truck Carrier Tool) shows class 7 mileage weighted Percent of Urban Operation data for the most populous SmartWay carrier categories: Truckload Dry Van, Less-Than-Truckload Dry Van, Refrigerated, Dray, and Mixed (fleets that are not predominantly one of the other types).
About SmartWay Trends, Indicators and Partner Statistics (TIPS)
EPA compiles and analyzes data from key segments of the freight transport industry and presents it using informative graphics, charts, and statistics, with links to related information. This collection of leading freight transportation facts, current SmartWay Partner performance metrics, and other notable resources related to transportation supply chain sustainability is known as SmartWay Trends, Indicators, and Partner Statistics, or SmartWay TIPS.

